Wal-Mart (NYSE:WMT) is looking expensive, trading near 52-week highs at 21.0x TTM P/E. After its investor meeting on October 10th, shares skyrocketed from the $80-mark and have hovered around $86 since. While the company might be making the right moves, the 21.0x P/E is unjustifiably high to me, given Q2 sales growth of 2.1% and also given rising competitive rivalry in the retail space as traditional players rush to compete with Amazon (AMZN). In my opinion, all the new competitive offerings and acquisitions by Wal-Mart are a case of running hard to stand still. As investors start to view Wal-Mart as a tech leader in the retail space and viable competitor to Amazon, they are pushing its valuation higher and I will be staying on the sidelines.
What Happened at the 2017 Investor Community Meeting?
Wal-Mart reconfirmed its FY 2018 adjusted EPS outlook of $4.35 to $4.40 and said it expects 2019 adjusted EPS to be 5% higher than FY 2018. At the midpoint of guidance, this would put the forward P/E at 20.0x for FY 2018 and 19.0x for FY 2019. Supporting this 5% EPS growth will be the newly announced share repurchase program of $20B to be completed over the next two years. At Wal-Mart’s current market cap around $260B, this buyback would represent roughly 7.7% in total or 3.8% for each of the next two years.
Alongside these financial items, Wal-Mart also announced some innovative offerings that will help the company stay competitive in the changing retail landscape. A few highlights are below:
- Free two-day shipping without an annual subscription,
- Pick-up of online orders from its 4,700 plus stores,
- Online grocery orders now shipping from 1,000 U.S. stores,
- Mobile Express Checkout which allows customers to self-scan items from their phone as they shop and then simply show an associate the receipt as they leave,
- Other Mobile Express offerings include pick-up of online orders from automated "towers" in-store, express returns, and online prescription renewals.
These offerings are sure commendable, and to get a true sense of them you will need to watch the opening minutes of 2017 Investor Community Meeting video which shows them in action. One fact that also stood out to me was that Wal-Mart’s store and warehouse network in the U.S. allows it to ship to 99% of the country by ground in two business days and 87% of the country overnight. With no membership fee required for such services, Wal-Mart is striking a nice hit back against Amazon.
Running Hard to Stand Still
However, all this talk about innovative offerings means little if it does not drive outsized growth. The recent Q2 numbers released in August showed total global revenue growing 2.1%, with Wal-Mart’s U.S. comparable sales growth being 1.8% and traffic growth being 1.3%. In my opinion, these growth figures do not justify a +20x P/E valuation. While management discussed how customers who shop both online and in-store spend around twice as much as a customer who shops only in-store, I do not think the time series of data is long enough yet to draw any meaningful conclusions and forecast out anything along those lines. I find it hard to believe that the world will start buying twice as many groceries and T-shirts just because they can shop online. If that were the case, the obesity crisis is about to get a whole lot worse.
To assume every customer who shops online and in-store will spend twice as much would assume a massive growth in Wal-Mart’s market share. However, its competitors are not standing still, with most rolling out their own online offerings as they use their retail and warehouse network to their own advantage to better compete with Amazon (such as Kroger's (KR) own online grocery service ClickList). Any innovative idea Wal-Mart comes out with will probably be little more than a fleeting first-mover advantage as competitors rush to create similar e-commerce and mobile offerings. With Amazon moving more into brick and mortar through its purchase of Whole Foods and partnership with Kohl's (KSS), the line between traditional retailers and e-commerce players is becoming more blurred and competitive rivalry is heating up.
Share Buyback Supporting EPS Growth
Wal-Mart’s 10-year average EPS growth has trumped its growth in net income due to a healthy amount of share repurchases. While net income growth has only averaged 1.9% annually over the past decade, growth in EPS has been a solid 4.9%. Since the end of FY 2008 when share count was 4,072 billion, shares outstanding have declined to 3,112 billion at the end of FY 2017 through $67.3B worth of share repurchases, and currently sit at 3,061 billion shares as of the last quarter. This reduction would produce an average buyback yield of 2.8%, which, when combined with the current 2.3% dividend yield, would point to a respectable total shareholder yield of 5.1%.
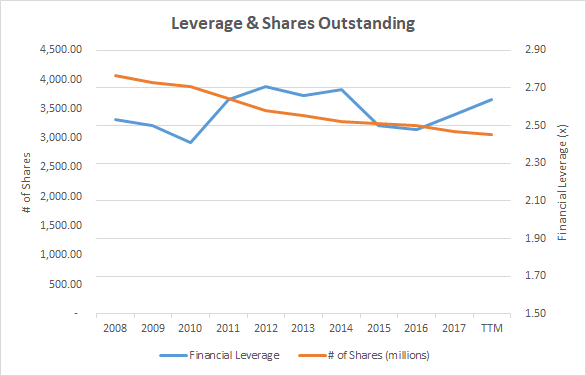
Source data from Morningstar
As can be seen in the above chart, much of these share repurchases have been healthily financed through free cash flows with financial leverage remaining just over 2.5x throughout the decade. With capital expenditures forecast by management to fall due to less spending on new store openings, the current two-year $20B share repurchase program looks like it won't be Wal-Mart's last.
Valuation Relative to Other Retailers
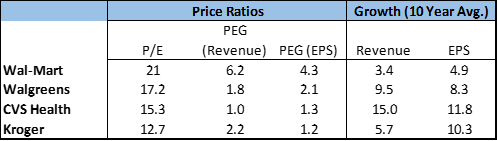
Wal-Mart is a great company but its valuation is expensive compared to some of its competitors. When looking at steady growth companies such as Wal-Mart, a good tool to use is legendary investor Peter Lynch's PEG ratio. To get an idea of how Wal-Mart's market valuation compares to competitors Walgreens Boots Alliance (WBA), CVS Health (CVS) and Kroger, I have placed them all side-by-side.
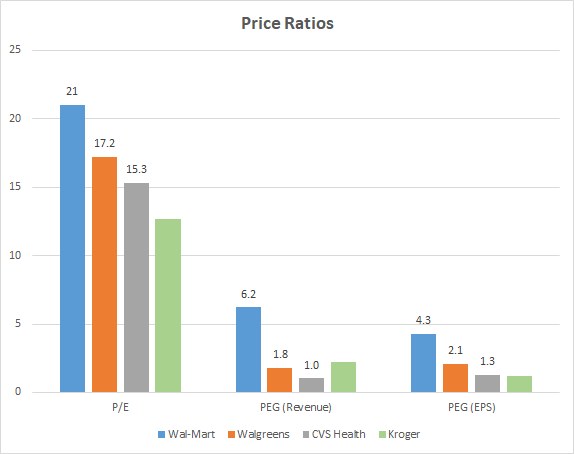
Source data from Morningstar
As can be seen, Wal-Mart's market valuation does not reflect favorably to its peers and its average Revenue and EPS growths have been bottom of the pack. Wal-Mart's PEG ratios of 6.2x (Revenue) and 4.2x [EPS] are also well above Peter Lynch's rule of thumb of being under 2x as a PEG ratio over 2x suggests that earnings growth is already built into the price.
Takeaway
Wal-Mart's valuation has gotten well ahead of its competitors. While it might be able to compete with Amazon, that is no reason for investors to start assuming it will be able to grow above what its recent history suggests. In my opinion, all the new competitive offerings and acquisitions by Wal-Mart are a case of running hard to stand still. As investors start to view Wal-Mart as a tech leader in the retail space and viable competitor to Amazon, they are pushing its valuation higher. I will be staying on the sidelines and looking to invest in cheaper companies.
For readers interested in my articles on Kroger, CVS Health, and Walgreens you can click on the links in this sentence.
If you enjoyed this article and would like to read more of my work, click the Follow button at the top of the page to receive notifications when I post a new article!
Disclaimer: While the information and data presented in my articles are obtained from company documents and/or sources believed to be reliable, they have not been independently verified. The material is intended only as general information for your convenience, and should not in any way be construed as investment advice. I advise readers to conduct their own independent research to build their own independent opinions and/or consult a qualified investment advisor before making any investment decisions. I explicitly disclaim any liability that may arise from investment decisions you make based on my articles.