This article is aimed at investors (someone with an investing timeline of over 6 months) and not traders (someone with an investing timeline of 1 day to 2 months).
I have been incorrectly anticipating a top in the U.S. markets for over 6 weeks. I have been stopped out twice at a loss, and I am carrying a losing half position in the Russell 2000. It may seen logical at this time to abandon the process of picking a top. However, the economic backdrop in the U.S. is not conducive to this type of rally (32% in 6 months for the S&P500).
Lance Roberts wrote a good article which suggests that the U.S. has missed 14 out of the last 16 economic data points (Zerohedge now has 15 of the last 17). However, I can feel the bulls shaking their heads in disbelief at such silly talk, picking a top in this environment! Has the commentator not being paying attention -- QE3! The economics are not conducive of a rally, so what-- so the Fed prints, the market goes up. Everyone knows about the Bernanke put!
I applaud all participants that have fully engaged in this rally. Either you have a bullish position on the U.S. and world economy (which I do not), or you have strong nerves. If you are the former, you may have some surprises in store in the coming 3 months. If the latter, you have my admiration. I have sat out this rally since October, only going long twice and making small profits before cashing in, as I do not like the fundamentals and feared a drop -- a weak hand indeed!
Any readers that think ahead whilst reading have probably already have figured out that I am about to try and pick a top again-- and I am, so here goes. In a very good article on Elliott wave counts for the U.S. markets, Avi Gilburt argues for more upside, and this seems to be logical. However, I would add my own opinion, that we are in a serious danger zone now and any long positions are taking on substantial risk for the reward that they may reap. Let me explain-- the upside from here would seem to be:
1. We are now in Elliott wave 5 from March 09 for the S&P500:
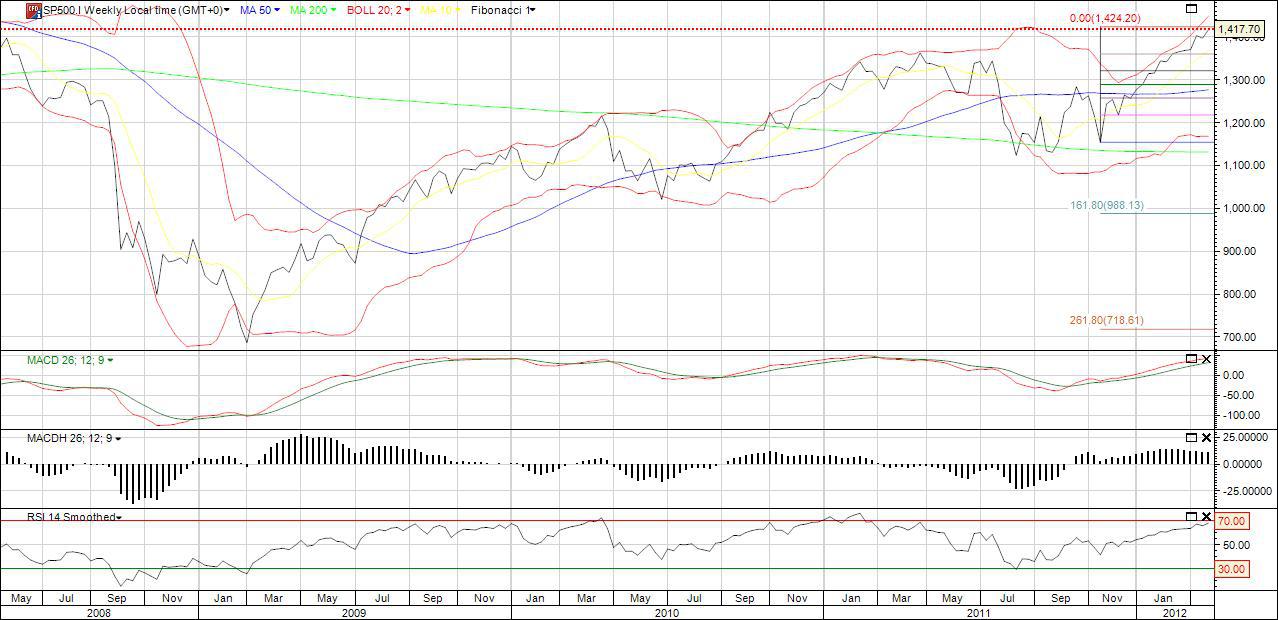
As you can probably see, I have my Fibonacci retracements already drawn (on the far right). The waves so far for the S&P500 (see chart) are;
Wave 1. 666-1218 (taking 13 months) gain 552
Wave 2. 1218- 1020 (taking 3 months) loss 198
Wave 3. 1020 - 1374 (taking 10 moths) gain 350
Wave 4. 1374- 1074 (taking 5 months) loss 296
Wave 5. 1074 - ?
Therefore, the projection is for the market to top between 1424 and (1074 + 350) and 1626 (1074 + 552). I maintain that we are in the danger zone now. The timescale of the rally would seem to be reducing for each up wave, so this rally could be anywhere between 7 and 10 months long. It began at the start of October 2011 so will end somewhere between April and July 2012. It looks to have some more room to run, both in timescale and price!
The question remains: why do I feel that this is so risky? The upside at the absolute best is 1626, which is 14.5% from today's 1420. What might the downside be? If this top is not an intermediate top but a long term top, the downside is unlimited (technically to zero only). Taking 14.5% downside from today gets you to 1214. If you think that this is a possible downside target then you are taking a 50-50 bet today -- there is no more upside than downside. Is that not risky at the end of a 3 year rally of over 100%? Obviously, if you feel that this bull market is here to stay for its usual 15-20 years, this is a different matter. I would suggest that this view is probably confined to the perma-bulls and very few others. It also depends whether you are a trader or investor as to what positions you may take.
So back to where we started-- and that is QE3. For the market to progress (if data points keep missing, as they have dome for the last 2-3 weeks) it requires QE3. This would seem to be what is left in those circumstances, the economic miracle is delayed once again and the economy needs more stimulus. How much juice will QE3 have in the present situation - 5%,10%,15% upside for stocks, more? I would argue not much at present levels:
1. Profit margins are high so earnings growth is going to have to come from increased sales -- difficult in the present economic environment.
2. Where will fiscal policy go in 2013?
3. How deep will the European recession be?
4. China?
5. Japan?
All of these inputs are going to have an effect on the QE3 ramp. I always think that it is a good idea to visualize the other side of a trade. The other side of the QE trade would be that QE3 resulted in a fall in the U.S. market. I bet no one out there has visualized that! Let's say that QE is launched in May and the S&P500 is at 1475, and in September the S&P500 is at 1350. That's the other side of the trade-- QE has happened and 4 months later the market is lower. Is it possible? You decide... However, this is what I am arguing.
So my top prediction now is a level around 1500 sometime in April. For me it will be a long term top (more in a future article) that will last for several years. Hopefully this will be my last 'top prediction'. If it is, it will be 150 S&P500 points above my first top prediction. Not so good, eh -- they say market predictions are a mug's game!
Disclosure: I have no positions in any stocks mentioned, and no plans to initiate any positions within the next 72 hours.
Additional disclosure: Long RIMM, RWM
Disclaimer: This article is not intended as investment advice. Before taking any action, please do your own research. Do not rely on any opinions or facts included in this article for decision making.