"What cannot be altered must be borne, not blamed."
Thomas Fuller
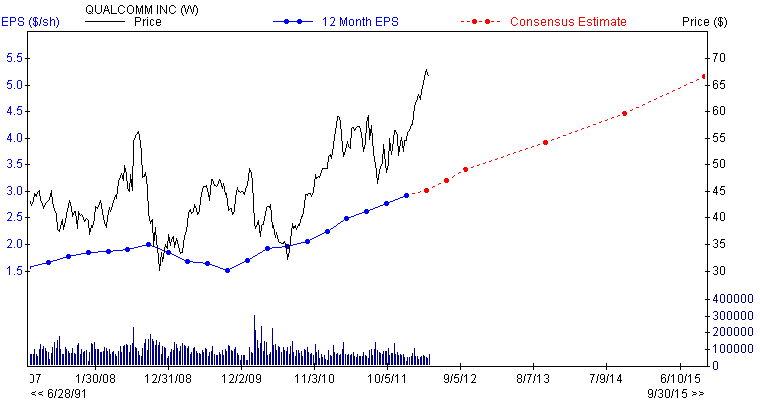
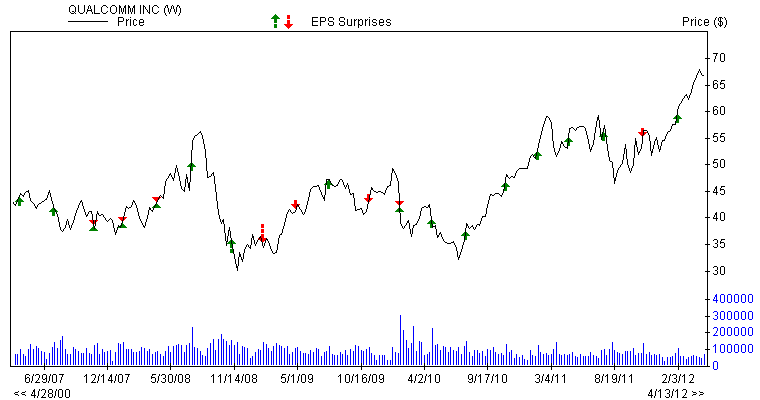
Qualcomm (NASDAQ:QCOM), incorporated in 1985, designs, develops, manufactures and markets digital telecommunications products and services. Qualcomm operates through four segments: Qualcomm CDMA Technologies, Qualcomm Technology Licensing, Qualcomm Wireless and Internet, and Qualcomm Strategic Initiatives. We like Qualcomm for the following reasons:
It reported record high results for the first quarter of 2012. Net income increased by over 20% year-over-year and by a huge 33% sequentially, which serves to highlight its operating efficiency.
Management is confident that Qualcomm will be in a position to maintain its current pace of growth for the next five years. Some reasons for these high expectations are: Huge growth of 3G smart phones in emerging markets, especially China where it has a very strong foothold; introduction of 4G LTE enabled phones in the U.S., Japan and south Korea; and its building a strong relationship with Apple for its iPhones and iPads.
It has decisively established its leadership in the high-end smart phone market and appears to have captured market share from its two rivals - Intel (INTC) and STMicroelctronics (STM). Until recently Intel's Infineon chipset was one of the main suppliers of Apple's top selling iPhone, but it appears that Qualcomm's snapdragon chip might have taken the top spot. Snapdragon chips are also used extensively in Android based phones and as Android based smart phones are the fastest selling phones on a global basis. Qualcomm stands to benefit from this trend.
In the first quarter of 2012, it shipped a record breaking 156 million MSM chipsets, up 32% year-over-year and 23% sequentially. At present, roughly 340 devices use the snap dragon chipset, and another 400 devices are in the pipeline. Management projects that the company will ship 146-154 million MSN chip sets in the second quarter.
Reasons to be bullish on Qualcomm Inc
- It has a strong levered free cash flow of $5.04 billion.
- Net income increased from $1.5 billion in 2009 to $4.2 billion in 2011.
- EBITDA increased from $3.03 billion in 2009 to $6.8 billion in 2011.
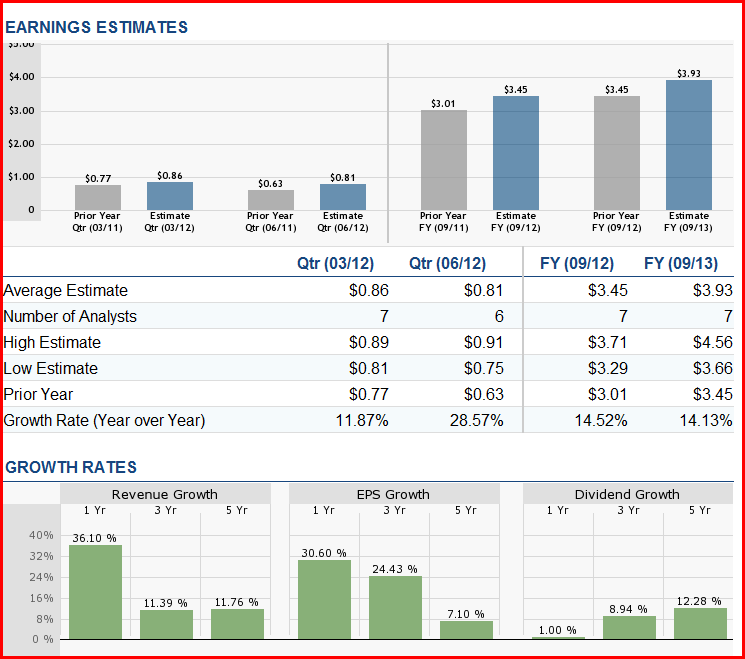
- It has a decent five-year sales growth rate of 11.7%.
- A great total debt to equity ratio of 0.03.
- A strong quarterly revenue growth rate of 39.8%.
- A good quarterly earnings growth rate of 19.7%.
- Strong institutional support; percentage held by institutions is 81.8%.
- Profit margins of 25%.
- Cash flow per share has increased from $1.91 in 2009 to $3.74 in 2011.
- Sales increased from $10.4 billion in 2009 to $14.9 billion in 2011.
- Annual EPS before NRI increased from $1.77 in 2009 to $3.01 in 2011.
- A free cash flow yield of 5.10%.
- A strong 5 year dividend growth rate of 10.42%.
- A low payout ratio of 29%.
- A good 5 year ROE average of 17.8%.
- A very good interest coverage ratio of 47.5.
- A good current and quick ratio of 2.81 and 2.56 respectively.
- $100K invested for 10 years would have grown to $387K.
Company: Qualcomm Inc
Levered free cash flow= $5.04B
Basic Key ratios
- Percentage Held by Insiders = 1.3
- Number of Institutional Sellers 12 Weeks = 3
Growth
- Net Income ($mil) 12/2011 = 4260
- Net Income ($mil) 12/2010 = 3247
- Net Income ($mil) 12/2009 = 1592
- 12months Net Income this Quarterly/12 months Net Income 4Q's ago = 25.59
- Quarterly Net Income this Quarterly/same Quarter year ago = 19.74
- EBITDA ($mil) 12/2011 = 6862
- EBITDA ($mil) 12/2010 = 5159
- EBITDA ($mil) 12/2009 = 3038
- Net Income Reported Quarterlytr ($mil) = 1401
- Annual Net Income this Yr/ Net Income last Yr = 31.2
- Cash Flow ($/share) 12/2011 = 3.74
- Cash Flow ($/share) 12/2010 = 2.54
- Cash Flow ($/share) 12/2009 = 1.91
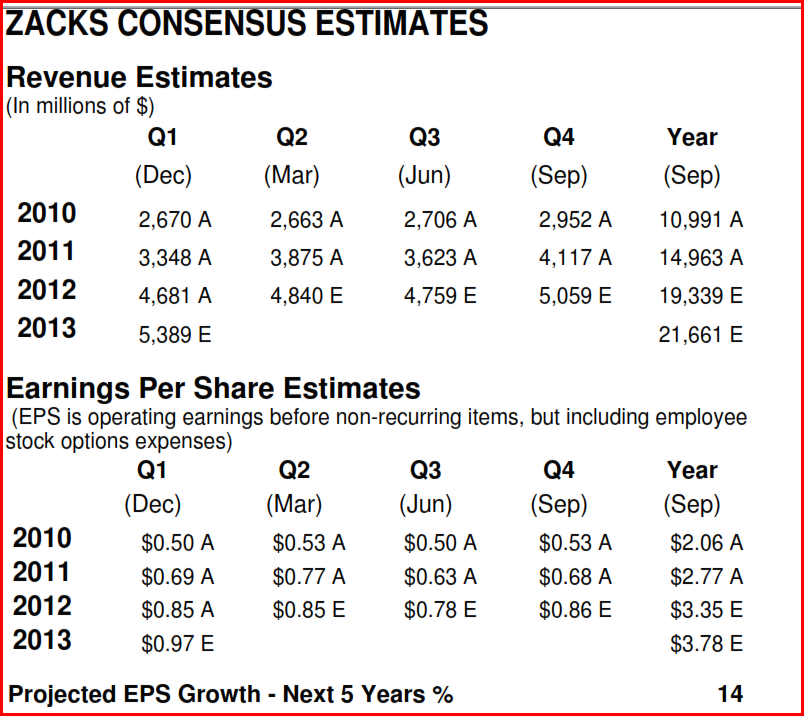
- Sales ($mil) 12/2011 = 14957
- Sales ($mil) 12/2010 = 10991
- Sales ($mil) 12/2009 = 10416
- Annual EPS before NRI 12/2007 = 1.77
- Annual EPS before NRI 12/2008 = 2.01
- Annual EPS before NRI 12/2009 = 1.52
- Annual EPS before NRI 12/2010 = 2.06
- Annual EPS before NRI 12/2011 = 3.01
Dividend history
- Dividend Yield = 1.3
- Dividend Yield 5 Year Average 12/2011 = 1.54
- Dividend Yield 5 Year Average 09/2011 = 1.54
- Annual Dividend 12/2011 = 0.81
- Annual Dividend 12/2010 = 0.72
- Forward Yield = 1.5
- Dividend 5 year Growth 12/2011 = 10.42
Dividend sustainability
- Payout Ratio 06/2011 = 0.29
- Payout Ratio 5 Year Average 12/2011 = 0.35
- Payout Ratio 5 Year Average 09/2011 = 0.35
- Payout Ratio 5 Year Average 06/2011 = 0.34
- Change in Payout Ratio = -0.05
Performance
- Percentage Change Price 52 Weeks Relative to S&P 500 = 20.13
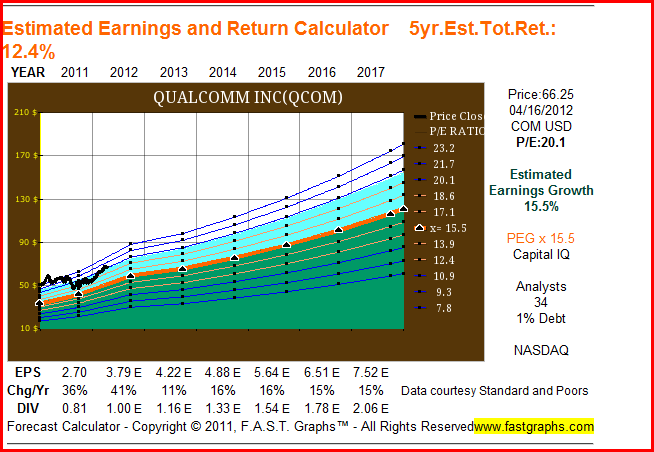
- Next 3-5 Year Estimate EPS Growth rate = 15.55
- EPS Growth Quarterly(1)/Q(-3) = -110.39
- ROE 5 Year Average 12/2011 = 17.82
- Return on Investment 06/2011 = 18.71
- Debt/Total Cap 5 Year Average 12/2011 = 0
- Current Ratio 06/2011 = 2.81
- Current Ratio 5 Year Average = 3.85
- Quick Ratio = 2.56
- Cash Ratio = 2.37
- Interest Coverage =47.5
Valuation
- Book Value Quarterly = 16.9
- Price/ Book = 3.92
- Price/ Cash Flow = 17.72
- Price/ Sales = 6.88
- EV/EBITDA 12 Mo = 14.65
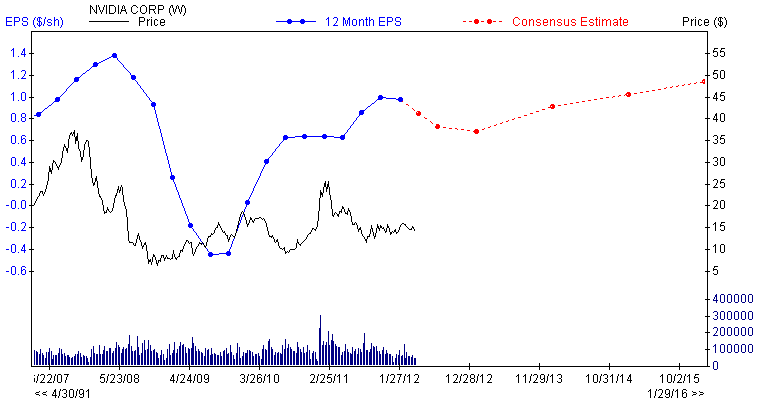
Company: Nvidia Corp (NVDA)
Basic Key ratios
Percentage Held by Insiders = 4.44
Growth
- Net Income ($mil) 12/2011 = 253
- Net Income ($mil) 12/2010 = -68
- Net Income ($mil) 12/2009 = N/A
- 12months Net Income this Quarterly/12 months Net Income 4Q's ago = 129.55
- Quarterly Net Income this Quarterly/same Quarter year ago = -32.41
- EBITDA ($mil) 12/2011 = 461
- EBITDA ($mil) 12/2010 = 118
- EBITDA ($mil) 12/2009 = N/A
- Net Income Reported Quarterlytr ($mil) = 116
- Annual Net Income this Yr/ Net Income last Yr = 129.55
- Cash Flow ($/share) 12/2011 = 0.98
- Cash Flow ($/share) 12/2010 = 0.36
- Cash Flow ($/share) 12/2009 = N/A
- Sales ($mil) 12/2011 = 3543
- Sales ($mil) 12/2010 = 3326
- Sales ($mil) 12/2009 = N/A
- Annual EPS before NRI 12/2007 = N/A
- Annual EPS before NRI 12/2008 = 1.31
- Annual EPS before NRI 12/2009 = 0.29
- Annual EPS before NRI 12/2010 = 0
- Annual EPS before NRI 12/2011 = 0.65
Performance
- Percentage Change Price 52 Weeks Relative to S&P 500 = -27.95
- Next 3-5 Year Estimate EPS Growth rate = 11.75
- EPS Growth Quarterly(1)/Q(-3) = 108.7
- 5 Year History EPS Growth 12/2011 = -9.88
- 5 Year History EPS Growth 09/2011 = -9.88
- ROE 5 Year Average 12/2011 = 14.82
- Return on Investment 12/2011 = 15.77
- Debt/Total Cap 5 Year Average 12/2011 = 0.54
- Current Ratio 12/2011 = 4.2
- Current Ratio 09/2011 = 4.2
- Current Ratio 06/2011 = 3.95
- Current Ratio 5 Year Average = 3.2
- Quick Ratio = 3.83
- Cash Ratio = 3.47
- Interest Coverage Quarterly = 41.45
Valuation
- Book Value Quarterly = 6.79
- Price/ Book = 2.06
- Price/ Cash Flow = 10.56
- Price/ Sales = 2.16
- EV/EBITDA 12 Mo = 6.36
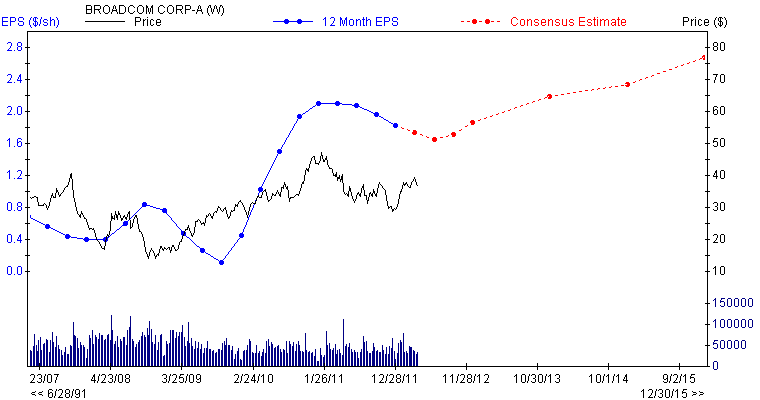
Company: Broadcom Corp-A (BRCM)
Basic Key ratios
Percentage Held by Insiders = 4.94
Number of Institutional Sellers 12 Weeks = 10
Growth
- Net Income ($mil) 12/2011 = 927
- Net Income ($mil) 12/2010 = 1082
- Net Income ($mil) 12/2009 = 65
- 12months Net Income this Quarterly/12 months Net Income 4Q's ago = -14.31
- Quarterly Net Income this Quarterly/same Quarter year ago = -4.58
- EBITDA ($mil) 12/2011 = 1240
- EBITDA ($mil) 12/2010 = 1254
- EBITDA ($mil) 12/2009 = 196
- Net Income Reported Quarterlytr ($mil) = 254
- Annual Net Income this Yr/ Net Income last Yr = -14.33
- Cash Flow ($/share) 12/2011 = 2.44
- Cash Flow ($/share) 12/2010 = 2.41
- Cash Flow ($/share) 12/2009 = 0.72
- Sales ($mil) 12/2011 = 7389
- Sales ($mil) 12/2010 = 6818
- Sales ($mil) 12/2009 = 4490
- Annual EPS before NRI 12/2007 = 0.39
- Annual EPS before NRI 12/2008 = 0.77
- Annual EPS before NRI 12/2009 = 0.46
- Annual EPS before NRI 12/2010 = 2.09
- Annual EPS before NRI 12/2011 = 1.84
Dividend history
- Dividend Yield = 0.99
- Annual Dividend 12/2011 = 0.18
- Annual Dividend 12/2010 = 0.32
- Forward Yield = 0.98
- Dividend 5 year Growth 12/2011 = N/A
Dividend sustainability
- Payout Ratio 06/2011 = 0.2
- Payout Ratio 5 Year Average 12/2011 = 0.08
- Payout Ratio 5 Year Average 09/2011 = 0.08
- Payout Ratio 5 Year Average 06/2011 = 0.07
- Change in Payout Ratio = 0.12
Performance
- Percentage Change Price 52 Weeks Relative to S&P 500 = -7.9
- Next 3-5 Year Estimate EPS Growth rate = 14.57
- EPS Growth Quarterly(1)/Q(-3) = -112.5
- ROE 5 Year Average 12/2011 = 11.93
- ROE 5 Year Average 09/2011 = 11.93
- ROE 5 Year Average 06/2011 = 11.83
- Return on Investment 06/2011 = 14.96
- Debt/Total Cap 5 Year Average 12/2011 = 3.04
- Current Ratio 06/2011 = 5.23
- Current Ratio 5 Year Average = 3.61
- Quick Ratio = 4.85
- Cash Ratio = 4.23
- Interest Coverage Quarterly = N/A
Valuation
- Book Value Quarterly = 12.1
- Price/ Book = 3.02
- Price/ Cash Flow = 14.96
- Price/ Sales = 2.7
- EV/EBITDA 12 Mo = 13.37
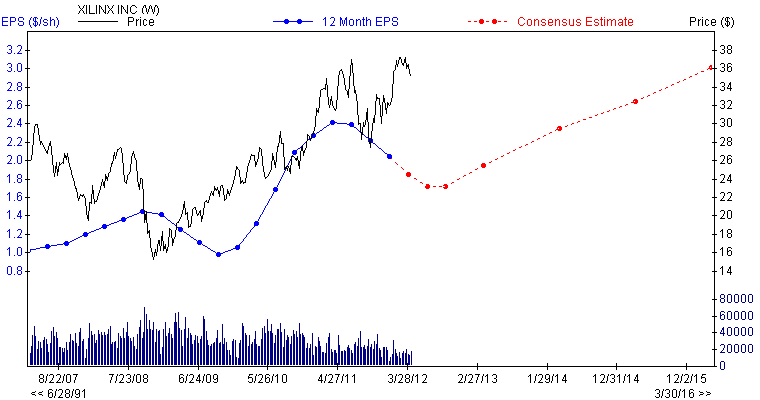
Company: Xilinx Inc (XLNX)
Basic Key ratios
Percentage Held by Insiders = 1.16
Growth
- Net Income ($mil) 12/2011 = 642
- Net Income ($mil) 12/2010 = 357
- Net Income ($mil) 12/2009 = N/A
- 12months Net Income this Quarterly/12 months Net Income 4Q's ago = -9.94
- Quarterly Net Income this Quarterly/same Quarter year ago = -16.63
- EBITDA ($mil) 12/2011 = 844
- EBITDA ($mil) 12/2010 = 491
- EBITDA ($mil) 12/2009 = N/A
- Net Income Reported Quarterlytr ($mil) = 127
- Annual Net Income this Yr/ Net Income last Yr = 79.55
- Cash Flow ($/share) 12/2011 = 2.77
- Cash Flow ($/share) 12/2010 = 1.58
- Cash Flow ($/share) 12/2009 = N/A
- Sales ($mil) 12/2011 = 2369
- Sales ($mil) 12/2010 = 1834
- Sales ($mil) 12/2009 = N/A
- Annual EPS before NRI 12/2008 = 1.27
- Annual EPS before NRI 12/2009 = 1.26
- Annual EPS before NRI 12/2010 = 1.32
- Annual EPS before NRI 12/2011 = 2.42
Dividend history
- Dividend Yield = 2.16
- Dividend Yield 5 Year Average 12/2011 = 2.35
- Dividend Yield 5 Year Average 09/2011 = 2.35
- Annual Dividend 12/2011 = 0.64
- Forward Yield = 2.5
- Dividend 5 year Growth 12/2011 = 10.84
Dividend sustainability
- Payout Ratio 06/2011 = 0.37
- Payout Ratio 5 Year Average 12/2011 = 0.41
- Payout Ratio 5 Year Average 09/2011 = 0.41
- Payout Ratio 5 Year Average 06/2011 = 0.4
- Change in Payout Ratio = -0.04
Performance
- Percentage Change Price 52 Weeks Relative to S&P 500 = 8.03
- Next 3-5 Year Estimate EPS Growth rate = 14
- EPS Growth Quarterly(1)/Q(-3) = 130
- ROE 5 Year Average 12/2011 = 22.07
- ROE 5 Year Average 09/2011 = 22.07
- ROE 5 Year Average 06/2011 = 21.67
- Return on Investment 06/2011 = 16.43
- Debt/Total Cap 5 Year Average 12/2011 = 27.59
- Debt/Total Cap 5 Year Average 09/2011 = 27.59
- Debt/Total Cap 5 Year Average 06/2011 = 28.01
- Current Ratio 06/2011 = 6.15
- Current Ratio 5 Year Average = 6.17
- Quick Ratio = 6.41
- Cash Ratio = 5.63
- Interest Coverage Quarterly = 19.1
Valuation
- Book Value Quarterly = 9.76
- Price/ Book = 3.62
- Price/ Cash Flow = 12.74
- Price/ Sales = 4.07
- EV/EBITDA 12 Mo = 9.93
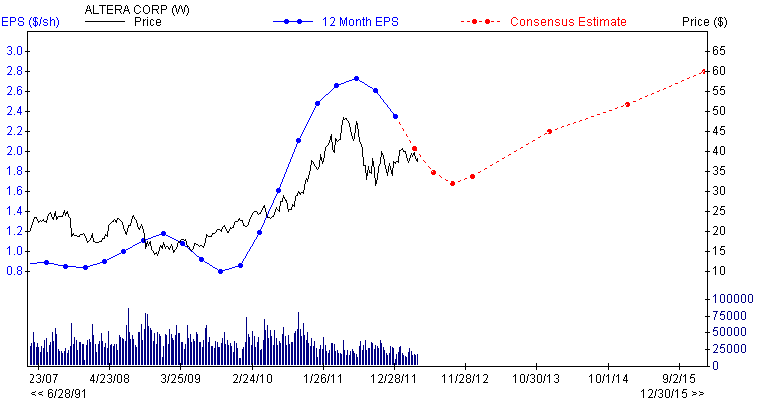
Company: Altera Corp (ALTR)
Basic Key ratios
Percentage Held by Insiders = 0.56
Growth
- Net Income ($mil) 12/2011 = 771
- Net Income ($mil) 12/2010 = 783
- Net Income ($mil) 12/2009 = 251
- 12months Net Income this Quarterly/12 months Net Income 4Q's ago = -1.56
- Quarterly Net Income this Quarterly/same Quarter year ago = -36.7
- EBITDA ($mil) 12/2011 = 885
- EBITDA ($mil) 12/2010 = 899
- EBITDA ($mil) 12/2009 = 340
- Net Income Reported Quarterlytr ($mil) = 147
- Annual Net Income this Yr/ Net Income last Yr = -1.56
- Cash Flow ($/share) 12/2011 = 2.5
- Cash Flow ($/share) 12/2010 = 2.59
- Cash Flow ($/share) 12/2009 = 0.97
- Sales ($mil) 12/2011 = 2064
- Sales ($mil) 12/2010 = 1954
- Sales ($mil) 12/2009 = 1195
- Annual EPS before NRI 12/2007 = 0.82
- Annual EPS before NRI 12/2008 = 1.18
- Annual EPS before NRI 12/2009 = 0.86
- Annual EPS before NRI 12/2010 = 2.49
- Annual EPS before NRI 12/2011 = 2.35
Dividend history
- Dividend Yield = 0.85
- Dividend Yield 5 Year Average 12/2011 = 0.86
- Dividend Yield 5 Year Average 09/2011 = 0.86
- Annual Dividend 12/2011 = 0.28
- Annual Dividend 12/2010 = 0.22
- Forward Yield = 0.85
- Dividend 5 year Growth 12/2011 = 14.68
Dividend sustainability
- Payout Ratio 06/2011 = 0.14
- Payout Ratio 5 Year Average 12/2011 = 0.16
- Payout Ratio 5 Year Average 09/2011 = 0.16
- Payout Ratio 5 Year Average 06/2011 = 0.16
- Change in Payout Ratio = -0.03
Performance
- Percentage Change Price 52 Weeks Relative to S&P 500 = -16.14
- Next 3-5 Year Estimate EPS Growth rate = 13.21
- EPS Growth Quarterly(1)/Q(-3) = 133.82
- ROE 5 Year Average 12/2011 = 33.72
- ROE 5 Year Average 09/2011 = 33.72
- Return on Investment 06/2011 = 25.08
- Debt/Total Cap 5 Year Average 12/2011 = 22.6
- Current Ratio 06/2011 = 3.91
- Current Ratio 5 Year Average = 4.1
- Quick Ratio = 3.79
- Cash Ratio = 3.56
- Interest Coverage Quarterly = 157.96
Valuation
- Book Value Quarterly = 9.33
- Price/ Book = 4.03
- Price/ Cash Flow = 15.02
- Price/ Sales = 5.88
- EV/EBITDA 12 Mo = 9.83
Conclusion
Prudent investors would do well to wait for a strong pullback before committing funds to this market. A pullback in the 7-12% ranges would qualify as a strong pullback.
Disclaimer
This list of stocks is meant to serve as a starting point. Please do not treat this as a buying list. It is imperative that you do your due diligence and then determine if any of the above plays meet with your risk tolerance levels. The Latin maxim caveat emptor applies let the buyer beware.
Disclosure: I have no positions in any stocks mentioned, and no plans to initiate any positions within the next 72 hours.
Additional disclosure: EPS, Price, broker recommendations and EPS surprise charts obtained from zacks.com. A major portion of the historical data used in this article was obtained from zacks.com. Earnings estimates and growth rate charts sourced from dailyfinance.com.