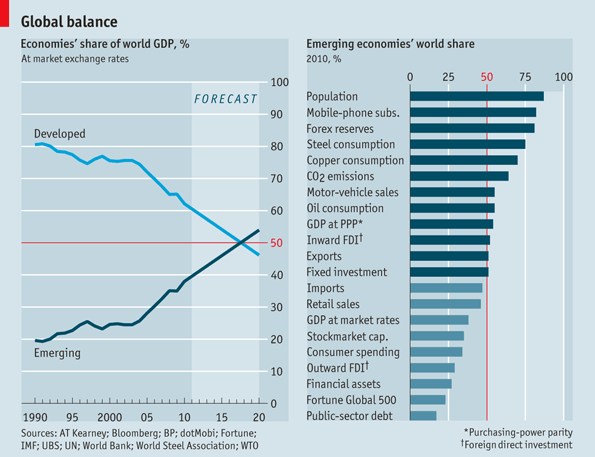
Emerging markets' (EM) share of equity representation is low compared to its GDP and critical mass.
The combined output of the emerging world accounted for 38% of world GDP in 2010 (2x its 1980 share). IMF projects its share to increase to 55% five years from now. They have also attained critical mass, accounting for over half of the global consumption of most commodities, world exports, and inflows of FDI.
(click images to enlarge)
Since the MSCI Emerging Markets Index was introduced in 1988, the weight of emerging markets in the MSCI All Country World Index (ACWI) has grown from less than 1% to over 14%, leading to a radical change in the opportunity set available to international investors.
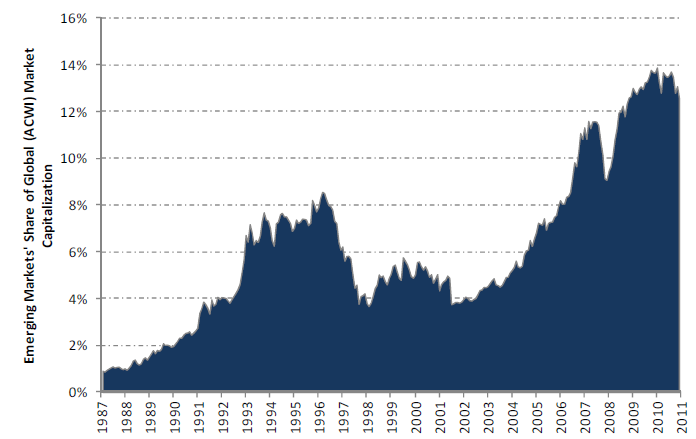
Source: MSCI
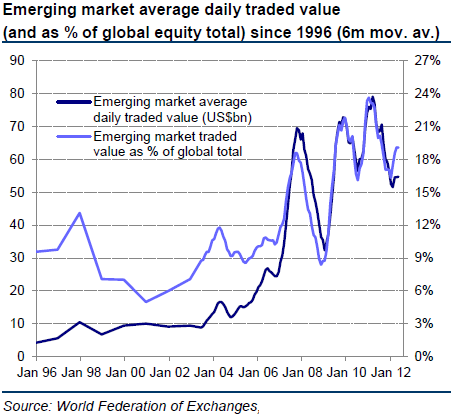
The total daily trading value for emerging market equities has risen 13x over the last 16 years to an average of US$55bn, with emerging markets now accounting for close to a 20% of total global equity turnover by value.
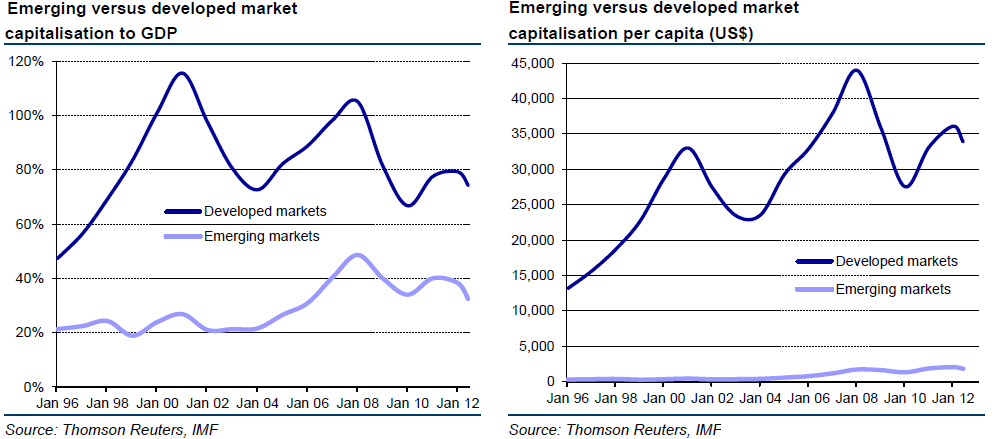
The growth in the share of emerging markets within global equities would continue given the relatively low equity representation levels in emerging markets relative to developed versus GDP (under half the ratio) and per capita (just one eighteenth). The deepening of emerging market equity (and debt) capital markets will likely continue as strategic stakes are offered and foreign investment restrictions are gradually relaxed.
Growth in the issuance of emerging market equities has coincided with the rise of stock exchanges in these economies, and they are becoming increasingly important venues for raising capital around the world.

Source: Deal Logic, Mckinsey
Stronger macro-economic characteristics and private sector credit growth
Emerging markets have run a structural current account surplus at the expense of developed markets for over a decade, and will continue to do so for at least the next five years on IMF projections.
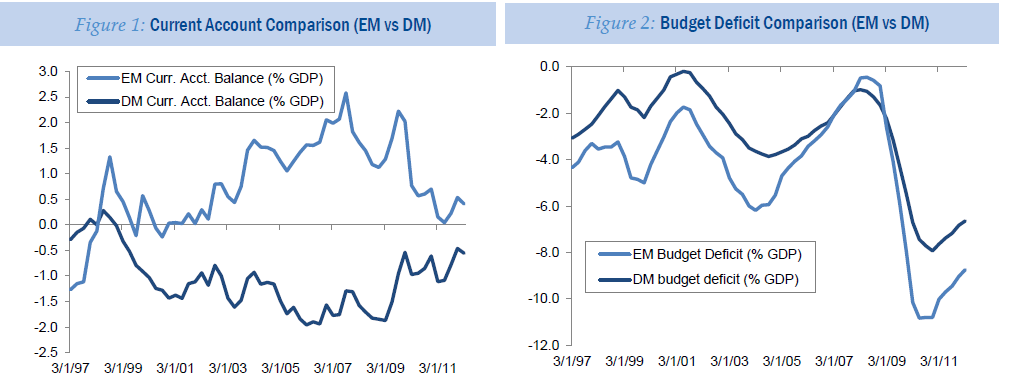
Emerging market sovereigns are typically far less indebted with significantly less fiscal constraints than developed economies.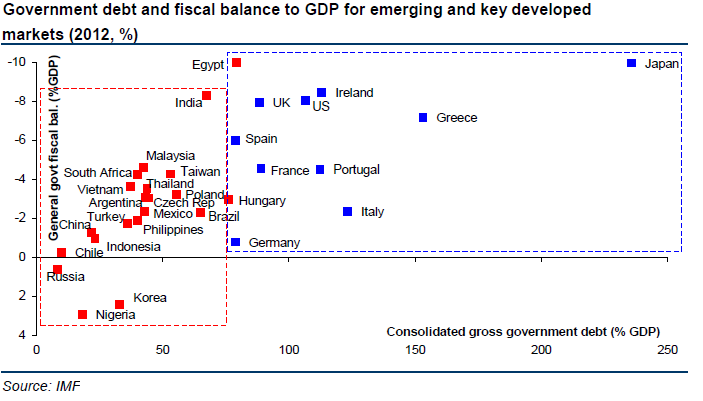
There remains considerable scope for expansion in private sector credit as i) emerging markets PPP GDP per capita grows, and ii) emerging markets with underpenetrated credit converge towards the global average.

Indeed, aggregate real private sector credit growth for emerging markets has been structurally higher than those delivered in developed nations for the last decade. Going forward, the best growth prospects remain in those countries where domestic loan funding is relatively abundant (i.e., loan to deposit ratios are short of 100%), which includes some of the larger emerging economies -- notably China and India. This compares to the eurozone and U.K., where aggregate loan to deposit ratios exceed 120%.

Emerging markets have exhibited a decade-long trend of superior value creation
This pattern of delivering incrementally higher value creation in emerging markets over time justifies the valuation convergence with developed market equities, which in the case of trailing relative asset-based multiples, has re-rated from a 40% discount in 2002 to a more than 10% premium currently.
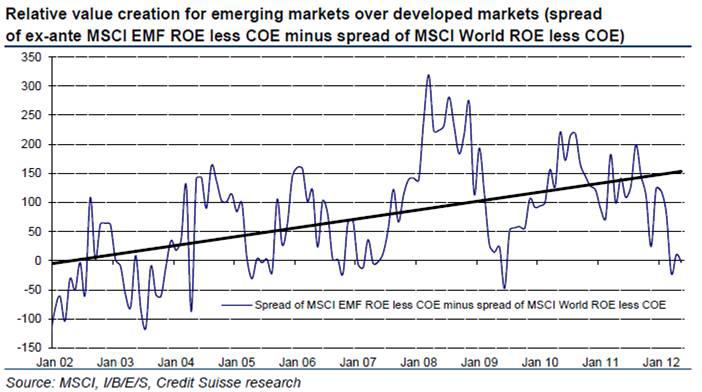
Critical to the investment case for emerging markets is that this positive spread reasserts itself going forward. Now let us gain some insight into the progression of the respective numerator and denominator of the equation for both regions to determine the ultimate turnout.
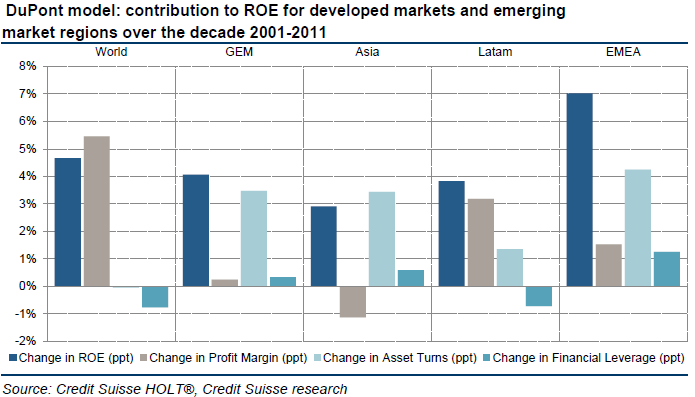
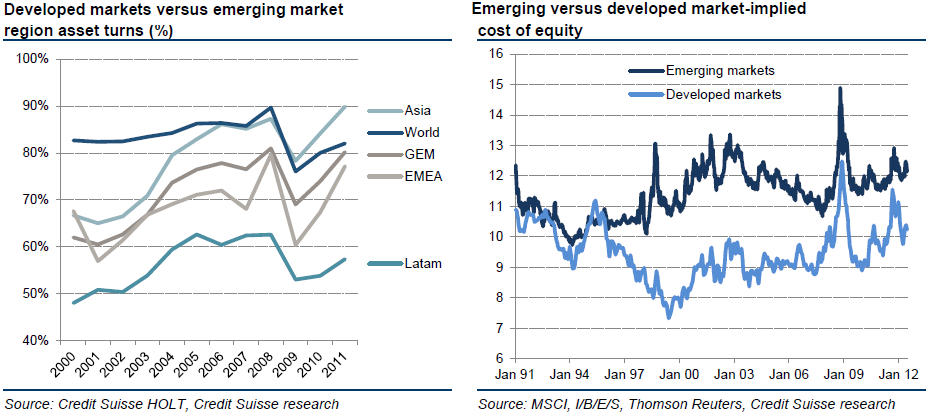
According to Credit Suisse, DuPont analysis decomposing the generation of ROE in emerging and developed markets over the past decade reveals that the change in ROE has been driven almost exclusively by increasing profit margins in developed markets versus improvements in asset turns for emerging equities:
- Asset turnover for EM has now almost fully converged with levels in DM equities
- EM do not yet employ financial leverage to the same extent as that in developed markets, which provides a further mechanism to boost relative ROE going forward
- The spread of cost of equity for emerging markets over that of developed remains despite improvements to its investment environment
Ultimately, the cost of equity for emerging markets has remained elevated during a risk-averse environment relating to a succession of developed world originated crises, and has ample room to fall.
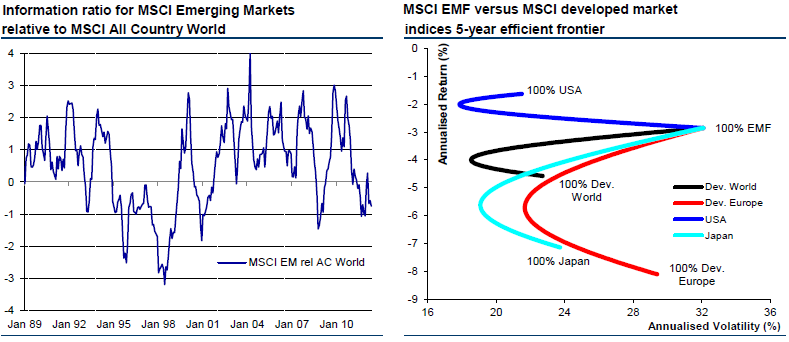
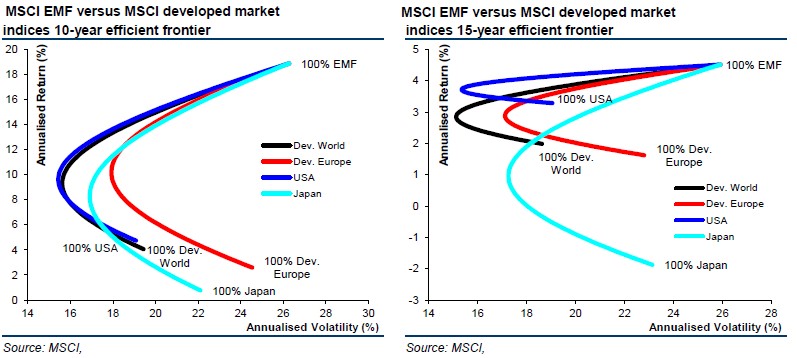
Superior risk adjusted returns for emerging versus developed market equities
EM equities have delivered superior risk adjusted returns over developed market equity indices for two thirds of the time going back in excess of 20 years
U.S. investors can take exposure to Emerging markets using the following ETFs:
- iShares MSCI Emerging Markets Index Fund (EEM)
- Vanguard Emerging Markets ETF (VWO)
- WisdomTree Emerging Markets High-Yielding Fund (DEM)
- iShares S&P Latin America 40 Index Fund (ILF)
- iShares MSCI BRIC Index Fund (BKF)
- Market Vectors Brazil Small-Cap ETF (BRF)
- iShares MSCI Brazil ETF (EWZ)
- Market Vectors Russia ETF (RSX)
- iShares MSCI Turkey Investable Market Index Fund (TUR)
- Market Vectors Vietnam ETF (VNM)
- iShares MSCI Thailand Investable Market Index Fund (THD)
- iShares FTSE China 25 Index ETF (FXI)
- iShares MSCI All Peru Capped Index ETF (EPU)
- Global X FTSE Colombia 20 ETF (GXG)
- PowerShares India Portfolio ETF (PIN)
- iShares MSCI Malaysia Index ETF (EWM)
- iShares MSCI South Korea Index ETF (EWY)
- Global X FTSE Colombia 20 ETF (GXG)
- iShares S&P India Nifty 50 Index Fund (INDY)
- iShares MSCI South Africa Index Fund (EZA)
- iShares MSCI Russia Capped Index Fund (ERUS)
Disclosure: I have no positions in any stocks mentioned, and no plans to initiate any positions within the next 72 hours. I wrote this article myself, and it expresses my own opinions. I am not receiving compensation for it (other than from Seeking Alpha). I have no business relationship with any company whose stock is mentioned in this article.