A Ranking system sorts stocks from best to worst based on a set of weighted factors. Portfolio123 has a powerful ranking system which allows the user to create complex formulas according to many different criteria. They also have highly useful several groups of pre-built ranking systems, I used one of them the "Balanced2" in this article.
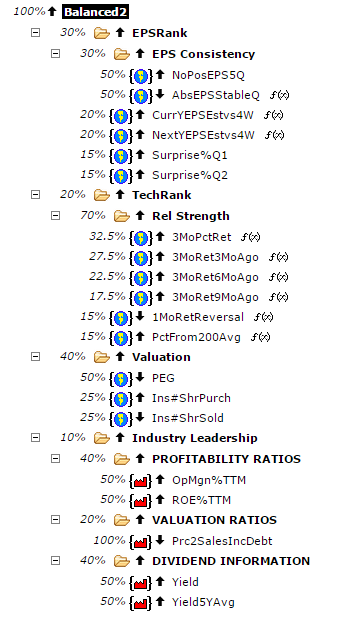
The "Balanced2" ranking system is quite complex, and it is taking into account many factors like; EPS Consistency, Technical Rank, Relative Strength, PEG ratio, Profitability Ratio, Industry Leadership and dividend yield, as shown in Portfolio123's chart below.
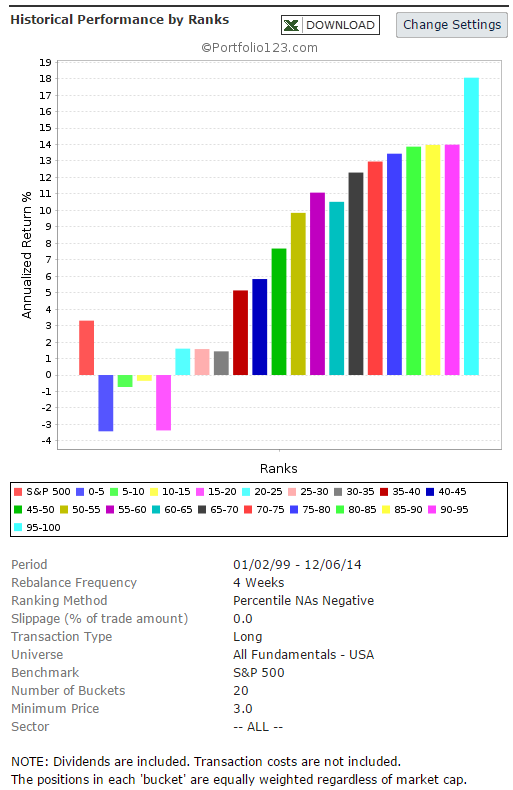
In order to find out how such a ranking formula would have performed during the last 16 years, I ran a back-test, which is available by the Portfolio123's screener. For the back-test, I took all the 7,014 stocks in the Portfolio123's database.
The back-test results are shown in the chart below. For the back-test, I divided the 7,014 companies into twenty groups according to their ranking. The chart clearly shows that the average annual return has a very significant positive correlation to the "Balanced2" rank. The highest ranked group with the ranking score of 95-100, which is shown by the light blue column in the chart, has given by far the best return, an average annual return of about 19%, while the average annual return of the S&P 500 index during the same period was about 3% (the red column at the left part of the chart). Also, the second and the third group (scored: 90-95 and 85-90) have given superior returns. This brings me to the conclusion that the ranking system is very useful.
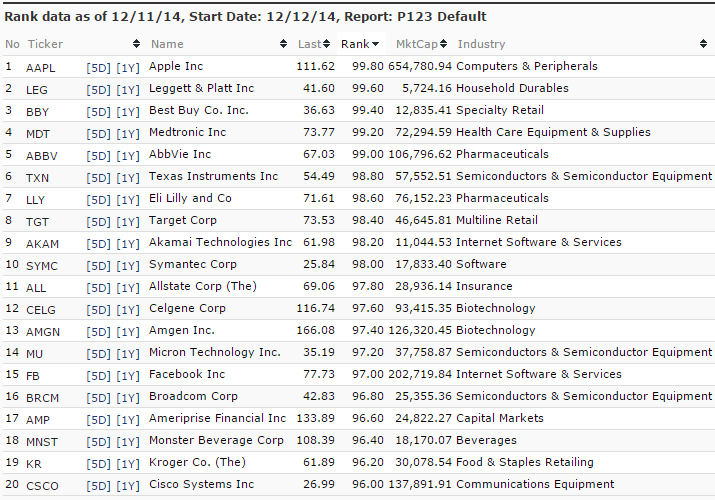
After running the "Balanced2" ranking system on all S&P 500 stocks, on December 12, I discovered the twenty best stocks, which are shown in the table below.
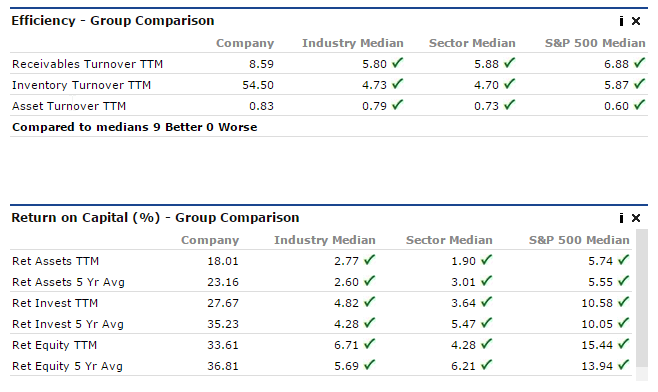
In addition, Apple's Efficiency and Return on Capital parameters have been much better than its industry median, its sector median and the S&P 500 median, as shown in the tables below.
Source: . Portfolio123