Background
I presented two indicators last week that investors in the cannabis industry can use as risk management and investment tools. The two indicators are
· Ayrot Cannabis Index ® (a stock index consisting of 19 equally weighted Cannabis stocks)
· Ayrot Cannabis Retail Interest Index ® (an indicator that measures the retail interest in investment opportunities in Cannabis stocks)
I showed the result of a study that I've done, which showed that the Ayrot Cannabis Retail Interest Index ® (or for short "ACRI Index") predicted the weekly development in the Ayrot Cannabis Index ® (or for short "ACI Index") with a 72.22% accuracy. The Ayrot Cannabis Index ® consist of the following 19 equally weighted stocks CannaVest Corporation (OTCQB:OTCQB:CANV), Cannabis Sativa, Inc. (OTCQB:OTCQB:OTCQB:CBDS), Cannabis Science, Inc. (OTCQB:OTCPK:CBIS), ENDEXX Corporation (OTCPK:OTCPK:OTCQB:EDXC), Fusion Pharm, Inc. (OTCPK:OTCPK:OTC:FSPM), GreenGro Technologies, Inc. (OTCPK:OTCPK:OTC:GRNH), GW Pharmaceuticals (GWPH), Hemp, Inc. (OTCPK:OTCPK:OTCPK:HEMP), mCig, Inc. (OTCQB:OTCQB:MCIG), Medbox, Inc. (OTCQB:OTCQB:MDBX), Medical Marijuana, Inc. (OTCPK:OTCPK:OTCPK:MJNA), Nuvilex, Inc. (OTCQB:OTCQB:NVLX), Growlife Inc. (OTC:OTC:PHOT), Vape Holdings, Inc. (OTCQB:OTCQB:VAPE), Plandai Biotechnology, Inc. (OTCQB:OTCQB:OTCPK:PLPL), Puget Technologies Inc (OTCQB:OTCQB:OTC:PUGE), Medical Cannabis Payment Solutions (OTCPK:OTCPK:OTCPK:REFG), Terra Tech Corp. (OTCQB:OTCQB:TRTC) and Aventura Equities, Inc. (OTC:OTC:AVNE). I also gave an account of why it makes sense that the development in the ACRI Index predicts the development in the ACI Index. If you haven't read the first article on the two indexes, I recommend reading the previous article, before moving on with reading this article.
Measuring the supply
As I promised in a previous article, I will present a comprehensive indicator that measures the supply of shares, which in collaboration with the use of the "ACRI Index" can deepen investors' insights into the supply and demand factors driving the share prices in industry. . This wouldn't have been possible without the indicators.
But, finding the right way to construct a comprehensive indicator that measures the supply of shares in the cannabis industry has been challenging. Even though that it sounds very simple to construct such an indicator, as one should simply add new share issued to the previous basic shares outstanding.
The problem with constructing the indicator in that way, is that it seldom gives any real insights to the real supply of shares, as a lot of listed companies in the cannabis industry has numerous other securities than common shares that can convert into common shares. Allow me to quote one of my previous articles:
"The extreme valuation might also be due to the fully diluted market caps of most of the medical marijuana stocks are higher than he one usually stated on financial websites. This is evident because most financial websites fail to include convertible debt, convertible preferred stocks, warrants and options into their calculations of market cap."
- - Abdalla Al-ayrot
Due to all these layers of securities that can be converted into common shares, one indicator to measure the amount of shares will simply be misleading. This is among other things due to the different limitations on the different types of securities. Let me in more detail explain why and give some examples of why it's misleading to use the fully diluted shares outstanding as a proxy for the supply of shares.
Fully diluted shares outstanding: the problem with using fully diluted shares outstanding is that some of the shares outstanding might be vested or restricted, which makes its use as an indicator of supply shares a bit misleading. This is due to the holders of vested shares can't sell their vested shares until they have vested.
Another misleading think about using fully diluted shares outstanding is that some options or warrants might only be possible to exercise years from now. So it would be misleading to count them as supply of shares right now, as they can't really be exercised, which means that it isn't possible for the holders to sell any of the shares that would have been created from an exercise at the current time.
A third misleading factor is that some shares bought by accredited investors in certain types private placements can't be sold on the public markets until a registration statement has been filed. So, it would be misleading if those shares were been included in the supply of shares when no registration statement has been filled, as the holders of these shares of these shares can't legally sell them on the stock market.
A fourth misleading factor about using the fully diluted shares outstanding as a proxy for the supply of shares, is that some convertible notes, which are included in the fully diluted shares outstanding, can't be converted unless specific criteria are met. One of such criteria could be that a given convertible note can't be converted into common shares before 2 years from now. The amount of shares that this convertible note is convertible into would be included in the fully diluted share count. But, these shares don't exist yet and can't be sold, yet. It would therefor be misleading to count these shares as a part of the supply of shares, as they can't be sold on the stock exchange.
But, how should we then measure the supply?
The key to measuring the supply of shares in a comprehensive way is to first define what we exactly want to measure and then find ways of doing so. So, let's define what we want to measure.
"We want to measure the amount of shares that are able to be sold on the stock exchange and/or bulletin board of a given stock"
Now that we have our goal defined in a clear manner, we can find a solution that accomplishes our goal.
In order to "measure the amount of shares that are able to be sold on the stock exchange and/or bulletin board of a given stock" we have to understand all of the securities outstanding of a given company. Because that's the only way to gain an understanding of all of the securities outstanding, which is needed to quantify how many shares are available to be sold. When we have gotten a deep understanding of all securities it's easy to "measure the amount of shares that are able to be sold on the stock exchange and/or bulletin board of a given stock". It also becomes easy to map future increases in the supply of shares in advance, as some securities may convert into shares or be able to convert shares at a given date in the future.
Unfortunately there are only few investors who have the resources available to get a thorough understanding of all securities outstanding of a given company, as this takes several hours of research and a thorough understanding of securities laws. Most investors lack the latter and a lot of investors don't want to read a lot of legal documents and SEC fillings, as it frankly can be quite boring.
In order to measure the supply of shares for an entire index, one would then have to get a thorough understanding of the securities outstanding of a number of companies, which literally takes hundreds of hours (if not thousands).
But, why was it that we wanted to measure the supply of shares for an entire index in the first place?
It was in order to get a thorough understanding of the supply and demand dynamics in the shares of companies involved in the cannabis industry. By understanding these dynamics we can predict the likely movements and potential market dislocations in the short-term. This can be used as an excellent risks management tool, as short-term market dislocations can create huge volatility and declines in share prices. Investors can avoid owning stocks during such declines by understanding the supply and demand dynamics.
One excellent point of time where investors could have avoided a 50% decline in stock prices by understanding these dynamics is the recent nearly 50% sell-off in the prices of cannabis stocks. The ACRI Index did warn a sell-off in advance, as I showed in my article on the ACRI Index. Such tools can also be used to buy stocks before big upswings in stock prices, as short-term market dislocations also can cause big increases in share prices.
But, one of the great advantages of measuring supply is that we can measure it for a very narrow subject, such as a single stock. This is opposed to measuring demand, which is limited to measuring the demand for the entire industry. As there aren't any cannabis indexes (that I'm aware of) that can be traded on an exchange through a broker, yet (Ayrot ® is currently working on making the ACI Index the first exchange traded one). It's easier for investors in the cannabis industry to make decisions on a stock specific level.
The Solution
The perfect solution to getting the maximum amount of insights into the supply dynamics of the cannabis industry is to make a platform that:
- Makes it possible for investors to chart the current, past and potential future share supply of a given company and an entire index
- Shows the current capital structure of a given company, including all outstanding securities and an explanation of each of them, so that every investor can understand them.
In order to make such a platform it's crucial to get the right data into the platform. A computer can't automate this, as a lot of the securities are explained in 8-K fillings and exhibits to fillings, which a computer can't read, understand and simplify it, so a human being can easily understand it.
In order for such a platform to work, one has to have experts to provide the platform with all of the data. These experts will have to read thousands of pages and keep the platform updated with the latest data from the covered companies latest SEC filings.
The benefits for investors using this platform are:
1. Investors save hundreds of hours, as they will now no longer have to use countless of hours just by understanding the capital structure. Hours of boredom are saved.
2. Investors can get deep and accurate insights into the supply dynamics on a stock specific level and on an industry level basis, as the platform will have to combine the data from several companies in one index.
It's actually quite absurd that there isn't any platform that provides 100% accurate data and reliable data about listed companies' capital structures. All of the platforms currently out there rely on XBRL-data, which is provided with 10-Q fillings and 10-K fillings and often doesn't include all securities. So, the current offerings by platform providers are quarterly updated (inaccurate) data on capital structures. That's why we have seen so many cases with financial websites and platforms listing a misleading market cap of a given company. This is especially with OTC and pink sheets companies as those companies often many different types of securities outstanding, which the XBRL-data fail to capture.
Ayrot seeks to change that. We have gathered a team consisting of:
- Experts who can read and interpret SEC and OTC filings in the right manner.
- Programmers and developers who can develop the platform.
This team is consisting of the right people, who can develop this platform and enhance investors' insights into supply dynamics in the shares of listed companies involved in cannabis industry.
So when can I access the platform?
Our programmers and developers think that they can complete the platform in 2 months. But, keep in mind that nearly all IT-projects in the entire world get delayed. So, we have decided to be conservative and plan to launch the platform within 4 months.
But, what about the demand factors?
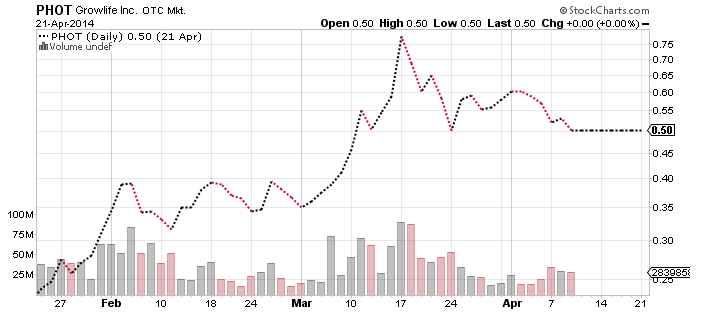
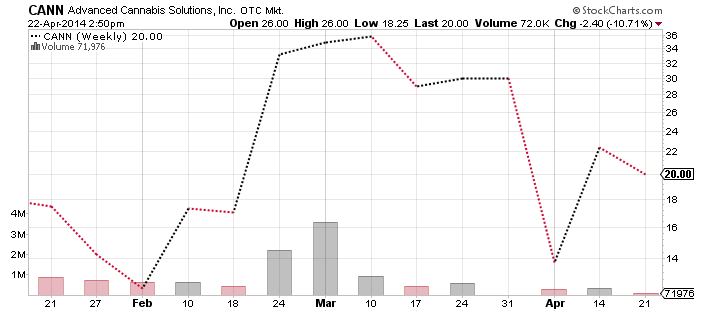
As promised last week, we have launched the Ayrot Cannabis Retail Interest Index ("ACRI Index"), which has historically predicted the movement in the Ayrot Cannabis Index with a 72.22% accuracy, and could have been used to avoid being invested in cannbis stock during the 50% decline in cannabis stock prices over the last 2 months. If you used the ACRI Index over the last couple of months, you would actually have been able to forecast the 50% decline in stock prices and could have even profitted from it. You could have earned a 50% return by shorting some of the cannabis stocks. Examples of stocks you could have shorted include Growlife and Advanced Cannabis Solution. The following chart shows the development in the price of these stocks:
I promised readers (after literally receiving hundreds of e-mails) that the website would launch Sunday at last, but due to technical difficulties the website has just gone online with full functionality (I'm writing this Monday evening).
I feel bad for the delay, so I will therefor make an exclusive deal for Seeking Alpha readers, as an apology.
If you subscribe to the premium research through this special link, you get a +20% discount on monthly subscriptions and +25% discount on yearly subscriptions. But, hurry up, as the discount only applies to the first 50 people who subscribe through the link.
Disclosure: I have no positions in any stocks mentioned, and no plans to initiate any positions within the next 72 hours. I wrote this article myself, and it expresses my own opinions. I am not receiving compensation for it (other than from Seeking Alpha). I have no business relationship with any company whose stock is mentioned in this article.