Macy's Inc. recently reported its preliminary financial results based on which CapitalCube provides a unique peer-based analysis of the company. Our analysis is based on the company's performance over the last twelve months (unless stated otherwise).
Macy's Inc.'s analysis versus peers uses the following peer-set: Target Corp. (TGT), TJX Cos. (TJX), Kohl's Corp. (KSS), Nordstrom Inc. (JWN), Sears Holdings Corp. (SHLD), J.C. Penney Co. Inc. (JCP), Dillard's Inc. Cl A (DDS) and Saks Inc. (SKS). The table below shows the preliminary results along with the recent trend for revenues, net income and returns.
| Quarterly (USD million) | 2012-10-31 | 2012-07-31 | 2012-04-30 | 2012-01-31 | 2011-10-31 |
|---|---|---|---|---|---|
| Revenues | 6,075.0 | 6,118.0 | 6,143.0 | 8,724.0 | 5,853.0 |
| Revenue Growth % | (0.7) | (0.4) | (29.6) | 49.1 | (1.4) |
| Net Income | 145.0 | 279.0 | 181.0 | 745.0 | 139.0 |
| Net Income Growth % | (48.0) | 54.1 | (75.7) | 436.0 | (42.3) |
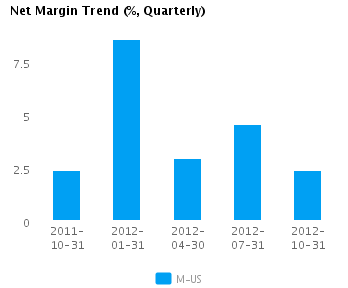
| Net Margin % | 2.4 | 4.6 | 2.9 | 8.5 | 2.4 |
| ROE % (Annualized) | 10.1 | 18.7 | 12.1 | 50.6 | 9.4 |
| ROA % (Annualized) | 2.7 | 5.3 | 3.3 | 13.4 | 2.6 |
Macy's Inc.'s current Price/Book of 2.8 is about median in its peer group. M-US's operating performance is higher than the median of its chosen peers (ROE of 23.7% compared to the peer median ROE of 16.0%) but the market does not seem to expect higher growth relative to peers (PE of 12.2 compared to peer median of 14.2) but simply to maintain its relatively high rates of return.
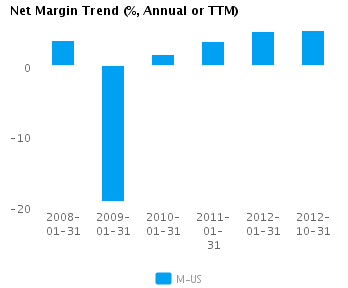
The company's asset efficiency (asset turns of 1.2x) and net profit margins of 5.0% are both median for its peer group. M-US's net margin is its highest relative to the last five years and compares to a low of -19.3% in 2009.
Economic MoatThe company enjoys both better than peer median annual revenue growth of 5.6% and better than peer median earnings growth performance 48.3%. M-US currently converts every 1% of change in annual revenue into 8.6% of change in annual reported earnings. We view this company as a leader among its peers.
M-US's current return on assets is around the same as its peer median (6.1% vs. peer median 6.3%). This recent performance contrasts with its less than peer median return on assets over the past five years (-0.9% vs. peer median 3.2%) suggesting that the company's relative operating performance is improving.
The company's comparatively high gross margin of 44.2% versus peer median of 36.5% suggests that it has a differentiated strategy with pricing advantages. However, M-US's pre-tax margin of 7.9% is around the peer median which, combined with the healthy gross margin, suggests higher operating costs relative to peers.
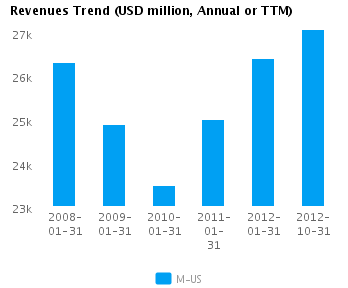
Growth & Investment StrategyM-US's revenues have grown at about the same rate as its peers (2.0% vs. 2.0% respectively for the past three years). Similarly, the stock price implies median long-term growth as its PE ratio is around the peer median of 12.2. The historical performance and long-term growth expectations for the company are largely in sync.
M-US's annualized rate of change in capital of -1.5% over the past three years is less than its peer median of -0.5%. This below median investment level has also generated a less than peer median return on capital of 6.1% averaged over the same three years. This outcome suggests that the company has invested capital relatively poorly and now may be in maintenance mode.
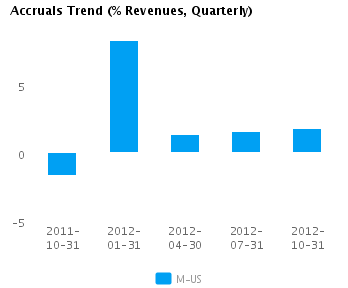
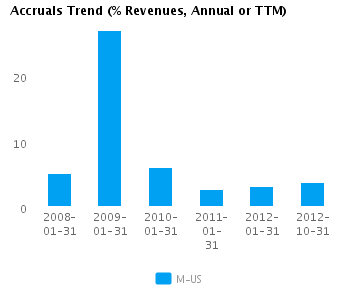
Earnings QualityM-US's net income margin for the last twelve months is around the peer median (5.0% vs. peer median of 4.9%). This average margin combined with a level of accruals that is around peer median (3.7% vs. peer median of 4.2%) suggests there possibly isn't too much accrual movement flowing into the company's reported earnings.
M-US's accruals over the last twelve months are positive suggesting a buildup of reserves. However, this level of accruals is also around the peer median and suggests the company is recording a proper level of reserves compared to its peers.
Trend Charts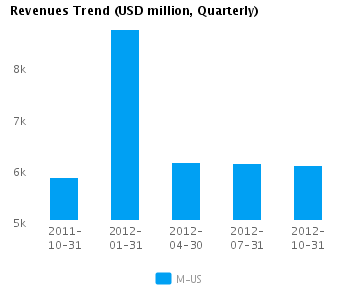
Macy's, Inc. operates department stores. The company provides services through Internet under two brand names: Macy's and Bloomingdale's that sells wide range of merchandise, including men's, women's and children's apparel and accessories, cosmetics, home furnishings and other consumer goods. It also operates seven Bloomingdale's outlet stores. It provides services through its subsidiaries which include Macy's Systems and Technology, Inc. and Macy's Merchandising Group, Inc. The company's Macy's Systems and Technology, Inc. subsidiary provides operational electronic data processing and management information services to all of the Company's operations. Its Macy's Merchandising Group, Inc. subsidiary designs and markets Macy's private label brands and certain licensed brands. The principal private label brands currently offered by Macy's include Alfani, American Rag, Bar III, Belgique, Charter Club, Club Room, Epic Threads, first impressions, Giani Bernini, greendog, Greg Norman for Tasso Elba, Holiday Lane, Hotel Collection, Hudson Park, Ideology, I-N-C, jenni by jennifer moore, John Ashford, JM Collection, Karen Scott, Martha Stewart Collection, Material Girl, Morgan Taylor, so jenni by jennifer moore, Sky, Studio Silver, Style & Co., Style & Co. Sport, Tasso Elba, the cellar, Tools of the Trade, Tools of the Trade Basics, and Via Europa. The company's logistics division provides warehousing and merchandise distribution services for its operations. Macy's was founded in 1820 and is headquartered in Cincinnati, OH.
DisclaimerThe information presented in this report has been obtained from sources deemed to be reliable, but AnalytixInsight does not make any representation about the accuracy, completeness, or timeliness of this information. This report was produced by AnalytixInsight for informational purposes only and nothing contained herein should be construed as an offer to buy or sell or as a solicitation of an offer to buy or sell any security or derivative instrument. This report is current only as of the date that it was published and the opinions, estimates, ratings and other information may change without notice or publication. Past performance is no guarantee of future results. Prior to making an investment or other financial decision, please consult with your financial, legal and tax advisors. AnalytixInsight shall not be liable for any party's use of this report. AnalytixInsight is not a broker-dealer and does not buy, sell, maintain a position, or make a market in any security referred to herein. One of the principal tenets for us at AnalytixInsight is that the best person to handle your finances is you. By your use of our services or by reading any our reports, you're agreeing that you bear responsibility for your own investment research and investment decisions. You also agree that AnalytixInsight, its directors, its employees, and its agents will not be liable for any investment decision made or action taken by you and others based on news, information, opinion, or any other material generated by us and/or published through our services. For a complete copy of our disclaimer, please visit our website analytixinsight.com.
Disclosure: I have no positions in any stocks mentioned, and no plans to initiate any positions within the next 72 hours. I wrote this article myself, and it expresses my own opinions. I am not receiving compensation for it. I have no business relationship with any company whose stock is mentioned in this article.