Rating/Analyst Recommendation:[1] Weak Buy ("weak" due to Risk)
Price (1 April 14, US $): 16.66
Target Price (US $): 27.87 (12-month)
52week price range: 15.56 - 19.65
Market Cap (US$): 5.93B
Enterprise value (US$): 9.289B
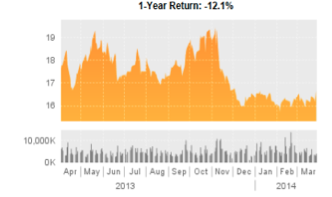
Share Price Performance (USD) Price and Volume Chart : 1-Year
Price | 16.66 | 1M Return | 1.0% | ||||
52 Week High | 19.65 | 6M Return | -10.2% | ||||
52 Week Low | 15.56 | 52 Wk Return | - 5.6% | ||||
52 Wk Beta | 1.20 | YTD Return | 2.1% | ||||
Source: DNR's MRQ Filing; all calculations are my own. | |||||||
Source: Thomas Reuters Fundamentals; Bloomberg Data Services
1.1 Business Summary
Denbury Resources Inc. is an independent oil and gas company in the U.S., operating primarily in the Rockies and Gulf Coast. DNR acquires, develops, exploits, and produces oil and gas in the U.S., owning the largest reserves of CO2 used for "tertiary oil recovery" east of the Mississippi River. As of 2011, the Company's properties with producing reserves in the Gulf Coast region are located in Mississippi, Texas, Louisiana, and Alabama; in the Rocky Mountain region, such properties are located in Montana, North Dakota, Utah and Wyoming. As of 2011, 77% of the company's 461.9 million barrels of proved oil and natural gas was oil, and 23% was natural gas reserves. In 2012, DNR sold several non-operated assets in the Greater Aneth Field in the Navajo Nation oil and Gas Company and Resolute Energy Company. In March 2013, DNR announced that it had closed the acquisition of oil and natural gas producing property interest in the Cedar Creek Anticline of Montana and North Dakota.
1.2 Fundamental Analysis: Balance Sheet and Cash Flow
DNR's fundamentals paint a fairly bullish picture, with moderate negative elements. On the shareholder equity front, the company has a modest 356.0 M shares outstanding, 349.7 M of which are floating shares. As of December 2013, institution ownership stood at 96.92% of float, and short interest as % of float stood at 7.21%. Table 1.A shows the company's financial summary as of April 1, 2014.The next paragraphs in this sections highlights DNR's key financial strengths and basic metrics.
Table 1. A: Denbury Resources Financial Summary
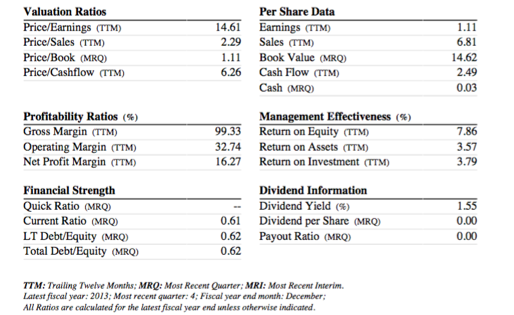
Source: Bloomberg Financial Services, compilation (Reuters, S&P Capital)
DNR's fundamental metrics are weakly favorable for value and growth prospects. The following, in particular, are noteworthy:
§ Sale: DNR's sales per share level stands at $6.81, and its total sales are $2.57B (TTM). The company's sales have grown steadily over the course of three years, and they are now at an "adequate size" for value and growth investors.
§ Price/Book Ratio: DNR has a very reasonable P/B ratio 1.15, which is reasonably in the
"buy" range for value and growth investors.
§ Free Cash Per Share: DNR has $0.29 free cash per share as of Q1 2014, which has steadily risen over the course of three years. This makes DNR unlikely to go out of business any time in the foreseeable future.
1.3 Target Price and Methodology
There are three widely accepted methods used to derive the target price of DNR: Fundamental Business analysis using market metrics and DNR's balance sheet, enterprise valuation (EV), and discount cash flow analysis (DCF). Below, each method is explored to model different target prices; then a composite average was taken for an overall target price. The following valuation ratios and metrics were used in the calculations. All price-targets are for 12-months.
Table 1. B Valuation Ratios and Metrics
12/10 | 12/11 | 12/12 | 12/13 | 12/14E | |
P/E | 31.58 | 10.64 | 11.38 | 11.1 | 17.5 |
P/S | 3.91 | 2.61 | 2.54 | 2.42 | 6.26 |
P/B | 1.74 | 1.22 | 1.19 | 1.19 | 1.5 |
Net Income (millions) | 573.33 | 525.36 | 409.60 | 575.50 | |
Cash Flow (billions) | 1.205 | 1.411 | 1.361 | 1.400 | |
Book Value (per share) | 14.78 | ||||
Sales (per share) | 6.80 | ||||
O/S Shares (millions) | 355.98 | ||||
P/C | 15.84 |
Method 1: Market Metrics and Balance Sheet
§ The target price based on my estimated 2014 price to cash would be: 25.81
èP/2014 Cash Flow per share = Estimate multiple or P/(575.50M/355.98M) = 15.84 so price target = 25.81
§ The target price based on my estimated multiple for price to book would be: $22.17
èP/2014 Book per share = Estimate multiple or P/14.78 = 1.5, so price target = $22.17
§ The target price based on my estimate for price to sales would be: $38.08
èP/2014 Sales per share = Estimate multiple or P/6.80 = 6.26, so price target = $38.08
§ The target price based on my estimated 2014 price to earnings would be: $43.88
èP/2014 Earnings per share = Estimated multiple or P/(575.50M/355.98M) = 11.5, so price target = 28.53
The composite method 1 valuation target price is: 1/4(25.81)+ 1/4(22.17) + 1/4(38.08) + 1/4(28.53) = $28.64
Method 2: Enterprise Value
§ In DNR's financial statements, they reported an enterprise value of $9.289B. Terminal year 2013 EBITDA is 3.56B. Assuming EBITDA is a proxy for cash flow, and using the enterprise value from the previous question, the EV/EBITDA multiple is 2.61. I believe that this multiple is wrong and should be 5.12, which slightly below the 5.5 estimated multiple given by Reuter's fundamentals. Using this modest multiple and DNR's reported cash from operations of 1.27B for 2013:
èImplied EV: 5.12*2.61B = 6.502 B +0.44B (Total Cash) == 6.945 B, which gives us implied Mkt Cap.
èPrice Target = 6.945B/ (355.98 Million shares) = $19.59
The composite method 2 valuation target price is $19.50.
Method 3: Discount Cash Flow
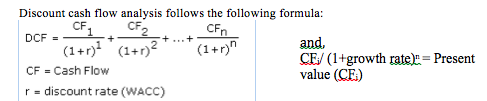
Using excel to calculate values plugged into the formula above, and relying on a "average" case scenario for free cash flow projections (see section 1.4 for further assumptions), we obtain a composite method 3 target price of $35.48:
DCF w/ dynamic growth | (35.48) | |
1 | 0.27 | 0.28 |
2 | 1.96 | 2.24 |
3 | 1.81 | 2.25 |
4 | 1.65 | 2.25 |
5 | 1.53 | 2.27 |
6 | 1.41 | 2.28 |
7 | 1.29 | 2.29 |
8 | 1.31 | 2.53 |
9 | 1.32 | 2.80 |
10 | 22.94 | 52.92 |
DCF w/ dynamic growth | 35.48 |
Therefore, the overall composite price target using an average of all three by weighing each methods equally is:
1/3 (28.64) + 1/3(19.509) + 1/3 (35.48) = $27.87, for 12 months YTD.
1.4 Additional Underling Assumptions to Support Target Price
Other than the projected values of future cash flow, sales, and book given in section 1.3, I am making four key assumptions to support my composite target price in section 1.3.
(1) Weighted Average cost of Capital (OTC:WACC) of 9.2%. I used the following calculation:
WACC = (E/V) *Re + (D/V) *Rd * (1-Tc), where Re = cost of equity, Rd = cost of debt, E = mkt value of the firm's equity, D = mkt value of the firm's debt, V= E+D, E/V is the percentage of financing that is equity, D/V = percentage of financing that is debt, and Tc = corporate tax rate. WACC is important because it is the average of the sources of financing, each of which is weighted by its priority in a given situation. In this case, I assume the company has to pay 9.2% interest for every dollar it finances.
(2) Enterprise Value growth rate of 1.0%. I take a conservative growth value estimate.
(3) Corporate Tax Rate of 36.23%. This is the current legal corporate tax rate that DNR pays.
(4) EBITDA Multiple of 6.8. I take this multiple from Reuters fundamentals and confirm it using basic raw data analysis in STATA.
(5) Growth Rate of FCF: 2% growth.
1.5 Rates of Return Analysis and 2014 Outlook
Defining our time horizon as 1-year and 3-years, the growth rates and averages for return on equity (ROE) has been 7.86% and 10.31%, respectively. In the context of economic environment and historical trends, DNR's ROE has been higher than the industry average.
However, according to its balance sheet, DNR's return on assets (ROA) has decreased from 6.0% in 2011 to 3.6% in 2013, but the decline is still lower than the industry average. Given a favorable 2014 economic environment with just modest growth and barring any constricting environmental or legal regulation, DNR is predicted to achieve rates of return on revenue (ROR), equity, and assets at higher levels than its peers. In fact, if the trend holds, one could see DNR's ROR go north of its current 16.3% level, which is still higher than many of its major competitors' such as Baytex Energy's 14.8% level and Carrizo Oil and Gas' 4.1% level.
1.6 Key Catalysts and Compelling Fundamental Metrics
There are several noteworthy catalysts and fundamental metrics that may have positive shocks on DNR in 2014. The following illustrate a shift from an industry laggard to a value creation culture within DNR.
§ Dividend: DNR has formalized initial for the first time in company history: it expects to pay an annual dividend of $0.25 per share in 2014 and a range of $0.50 to $0.65 per share in 2015; meanwhile, overall production guidance has been modestly above 80% of analysts' forecasts.
§ 2014 Guidance and Development plan: Production in Heidelberg, Hastings, Oyster Bayou, and Bell Creek have surprised on the upside and are the key growth drivers in DNR's forecast. Based on DNR's past guidance surprises and current production levels, I am forecasting and 77.0 million BOE/d in 2014, which represents a 10.2% YoY growth.
§ Current inventory vs. acquisition: As of December 2013, DNR has 451 MMBoe of proved reserves and 1.2 BBoe of 3P potential. In Q4's earnings call, management stated that DNR has 10 years of resource inventory to support its new growth outlook. Though there are many potential suitable acquisitions targets, it is currently a "seller's market," and DNR is unlikely to make any new acquisitions in 2014. However, at approximately 2.1 times debt to EBITDA, DNR is in a good position to use debt to finance potential acquisition, as the company could delever over time.
1.7 Special Situations and Events
There are three key dealings that could have a substantial impact on DNR's visibility, accountability, and cash flow via an influence on 2014 production. Below is a summary of the three key developments that could materially impact 2014 production.
(1) "Downdip" Pattern (Hastings): DNR is adding compression and recycle capacity at Hastings, as well as developing a new "downdip" drilling pattern there, which could materially bolster production by Q3 in 2014.
(2) A-2 Zone at Oyster Bayou: DNR increased its capex budget from $5 MM in 2013 to $50 MM in 2014 for Oyster Bayou, developing the injection process into the A-2 zone. Added production from A-2 zone may occur as early as Q4 2014 and become significant in early 2015, though DNR has not provided specific guidance on added production levels.
(3) Heidelberg: $90 MM of the $120 MM capex will be allotted to the Eastern part of Heidelberg, where DNR is expanding the Christmas and Eutaw zones in 2014. Depending on the progress of expansion, production levels could surpass guidance for Heidelberg in 2014.
1.8 Foreseeable Downside Risks
Risk is high for the industry as a whole, but could be relatively lower for DNR. Several potential downside risks are worth enumerating, not least because such factors could have a materially adverse shock on DNR's revenue levels in 2014. Risks to my composite 12-month target price of $27.87 include: decreasing Brent crude oil price, which would in turn decrease Light Louisiana Sweet crude oil prices, leading to reduced revenue, capex, and production levels for DNR in 2014. These risks are closely associated with geo-political relationships with oil exporting countries such as Saudi Arabia and Russia, as well as overall global economic conditions, both of which should be closely monitored if one has a position in DNR.
My risk assessment also reflects DNR's operations in a capital-intensive industry whose overwhelming source of revenue is derived from producing commodities with very volatile price movements. If a sustained decline in oil and gas price emerges in Q2 of 2014, DNR's stock price could suffer a 10-15% decline in 2014, based on historical trends in the industry; coupled with a an inability to replace reserves at a reasonable rate, this could lead downward volatile price movements. The foreseeable downside risks mentioned in this section paint a negative image of DNR's investment prospect. In the next section, I explore key risk metrics and calculations that paint a general good picture of DNR's 2014 risk prospects compared to the S&P 500 COMPOSITE INDEX.
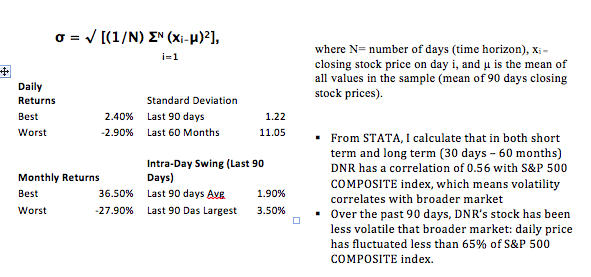
1.9 Risk Metrics and Calculations to Devise Them
The two key risk metrics to consider for a potential investment in DNR are standard deviations and time horizon. Using daily closing stock price data for the past 90 days from Yahoo Finance for DNR and for the S&P 500 COMPOSITE Index, I used STATA to calculate standard deviations of daily and monthly returns as well as Intra-Day Swings. (I also pulled up 60-month standard deviations as reported by Bloomberg. As a statistical measurement that sheds light on historical volatility, standard deviation is calculated as:
1.10 Technical Metrics and Key Entry & Exit PointsTechnical metrics and key entry & exit points indicate that DNR is a weak buy. The technical analysis discussed below reference Exhibit 1.10. According to this analysis:
§ The 50 -day moving average is rising.
§ The 200-day moving average is falling.
§ Support at 16.08 has been surpassed.
§ Price is above Resistance of 16.65
§ The U/D Volume Ratio is at 0.9 and the direction is up.
Exhibit 1.10 DNR Stock Price, Volume, and Technical Metrics
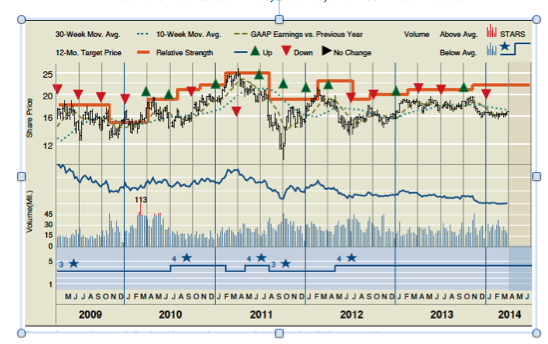
Source: S&P 500 COMPOSITE Index; standardandpoors.com
1.11 Technical Factors & Special Factors to Consider
Technical analysis therefore indicates that the key entry point is between 16.08 and 16.65. The moving average convergence/divergence (MACD) indicates a Bullish Trend and the chart pattern indicates a weak upward trend with moderate volume levels. The key exit point would occur when U/D ratio falls below 0.9 with a down direction, and when MACD indicates a Bearish trend.
Other technical factors to consider would be the slopes of Moving Averages. The 10-day, 21-day, and 50-day MA slopes are upward whereas the 200 day MA slope is downward. When looking at 12-month volume levels, the Up/Down patter indicates that the stock is under accumulation. With price above resistance, the technical recommend a buy at or below the 50-day MA of $16.18, which falls within the entry point of 16.08 - 16.65 range aforementioned. The exit point subsequently would occur between when MACD indicates a Bearish Trend and the target price of 27.87, unless production levels change and the company surprises on the upside. After entry, the time horizon is for 6 months or until 12-month target is hit (whichever comes first), ceterus paribus.
1.12 Industry & Competitive Analysis
In this section, I discuss the industry outlook for Oil and Gas Operations in 2014, as well as summarize key competitive metrics for DNR relative to those in its peer group. Though the price of crude oil has been historically volatile, barring any disconcerting geo-political event or adverse production level shocks, the industry is in a good financial position to address some of the key challenges it faces in 2014 as outlined below:
§ Capital Effectiveness and Financing: Research indicates that mid-sized and large sized companies in the industry are concurrently undertaking between three to five megaprojects which eat up more than 33% of their annual free cash flow. DNR is better poised than its larger sized competitors like XOM and CVX because it has generally smaller projects with smaller capital needs, as outlined in section 1.3.
§ Government and Regulatory Uncertainty: DNR does not face the higher levels of government regulation and uncertainty because most of its development is occurring in states that either have experience regulating oil and gas, or provide tax incentives and favorable financial climates for the industry.
§ Costs: Costs are expected to rise more than they did in 2013 for the industry. As companies focus on maximizing value, they must effectively operate to either reduce or sustain their current cost levels in the industry. DNR is better positioned than its larger peers to do this, as evidence by their confidence to complete a new dividend initiative.
Generally, barring any major shifts in environmental restrictive regulation, the outlook for the industry is positive, not least because companies like DNR are seeing rising liquefied natural gas (LNG) export approvals, growing need for natural gas for vehicle fleets, and increased demand power generation. If the positive outlook holds through Q2 of 2014, DNR could see the value in its oil and natural gas rise as prices rise further.
Exhibit 1.12 below gives a more fundamental picture of where the company stands relative to its peers.
Exhibit 1.12: Peer Analysis for 2014
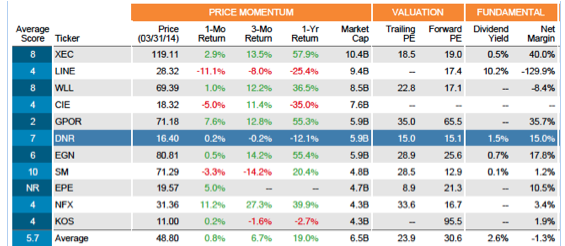
Note: Reuter's Fundamentals determine average score. Historically, companies who attained an optimized score of 7 (out of 10) tended to moderately outperform the market over the following 12-month period.
Source: Bloomberg Financial Services, Thomas Reuters (raw data).
Financial Strength (MRQ): The company's financial strength (MRQ) and Profitability denotes a fair condition, though more favorably than its peers. With a current ratio of 0.61x, debt/equity at 0.62x and debt/assets at 0.28x, the company is fair, but not great, shape. In particular, DNR's debt to equity ratio indicates that it has been more aggressive than its peers in using debt to finance growth. Because the Oil & Gas Operations industry is volatile due to price swings of crude oil and natural gas, the resultant effect on earnings is deemed as volatile as peer companies.
Valuation (MRQ): From Exhibit 1.A, we see that DNR's P/E ratio is comparable to other companies in the Oil & Gas Operations industry. In particular, a P/E ratio of 14.82x and a P/S is deemed at fair valuation, if not very slightly overvalued.
Profitability : At 99.33%, DNR's Gross Margin stands at more than 99% of other companies in the Oil & Gas Operations Industry. This implies that it has a much higher reserve of cash to spend on business and growth operations than its peers. At 32.64%, DNR's Operating Margin is 88% better than its peers', implying that DNR controls its costs and expenses very well compared to others.
Management Effectiveness : The key metric in this group is Return on Equity; the ROE of 7.86% for DNR indicates that it's able to reinvest its earnings more efficiently than 68% of its peers in the Oil & Gas Operations industry. With a fairly high ROE, relative to its industry, DNR should be more attractive to investors.
[1] Disclosure: Stock ratings are relative to the coverage universe of each analysts sector. Investing any stock carries risk that could lead to the loss of the entire investment. All opinions and analysis are my own, with properly cited sources and references at the end of this report. I do not have a position in DNR, nor do I plan on initiating one in the foreseeable future.
Disclosure Appendix
I, Blake J.A. have no position in DNR nor do I plan on initiating a new position in the foreseeable future. This work is purely academic and research in nature.
I, Blake J.A, certify that (1) the views expressed in these Investment theses accurately reflect my personal views of Denbury Resources, Inc. (DNR) (2) that I have received no compensation, nor will receive any remuneration, directly or indirectly, from the specific recommendations or views expressed in this Investment thesis
Academic Honor Code: On my honor, I have neither given nor received unauthorized aid. All work is solely my own, and all sources, including those for the figures above, are cited in all cases.
Disclosure: I have no positions in any stocks mentioned, and no plans to initiate any positions within the next 72 hours.