NEW SERIES ! - Probabilities for Profit - A Performance Forward Look at My Universe of ETFs - Update June 25th.
This is my focus on ETFs both Regular and Inverese. It is part of my 37 Similar Groupings:
My logo for over 50 Years is: "Investing Wisely."
Note: Breaking It All Down or (Dissecting) the entire Stock Market is what I do very, very well. When you have this giant task handled you Make Money Consistently. When you don't have IT handled you Lose Money Consistently. My Methodology is hard long hours of work but very rewarding. I have made if Fun over the years . . .
The below graphic is simple and what you must understand - - IF - - You want to consistently be a profitable Investor.
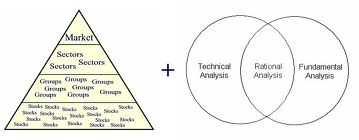
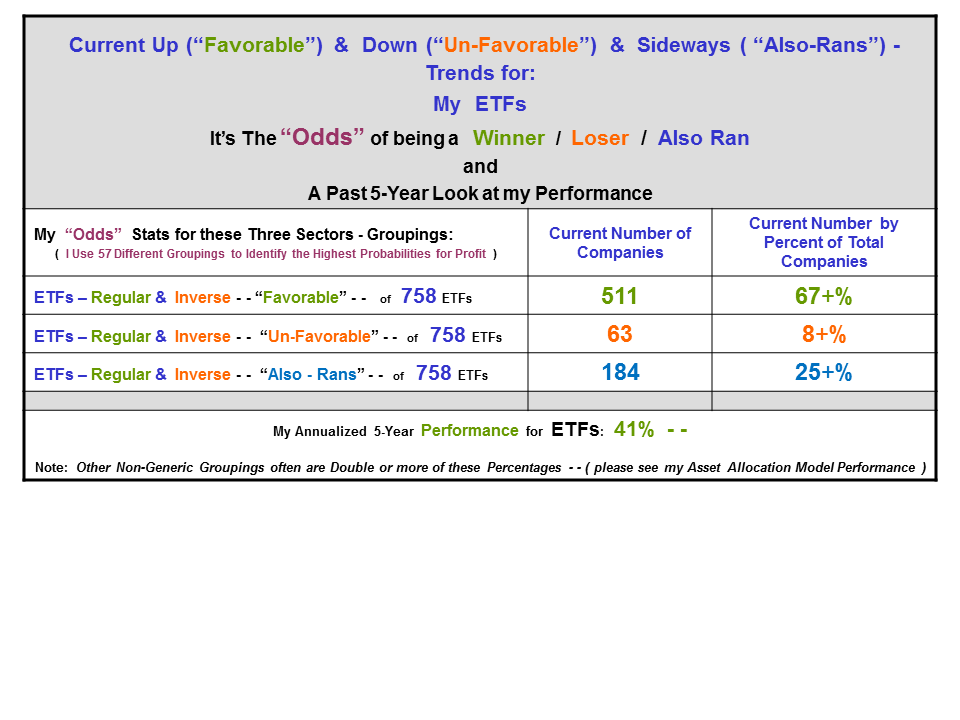
My below four Tables - Quantifies the "ODDS" of making money and being consistently profitable within my select U.S. General Market - - Sectors, Industry Groups and ETFs - - MY Groupings. Remember - Sectors and ETFs are a rather broad breakdown and perspective of the General Stock Market and its Indices - they must also be narrowed to the Industry Groups and then Identifying the Current "Favorable" / "Un-Favorable" and "Also-Rans." Narrowing the "broad breakdown" is mandatory these days and it is important to be reminded that each of my 37 Groupings have many component Companies.
At this writing these 37 Groupings (previous weekly data) contributes to the suggestion that the very old Bull General Market is deteriorating. At this stage of the Marketplace it is always a slow process of topping a multi-year bull market. It therefore requires much patience and discipline. Doing your homework each day over the years helps more than you might think.
Probabilities Can Be Easily Calculated from Data and Create "Odds"
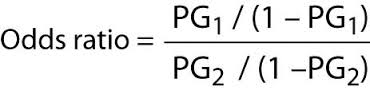
Yes, the "Odds" of being Profitable
- - Can Be - -
Calculated Ahead of Taking Securitas Positions
Buying or Shorting.
Probabilities are my way of using public information and data readily available on the Internet (mostly data) to compile and compute the forward / Bullish / Bearish or sideways Also-Rans direction of the stock market, sectors, industry groups, commodities, companies and ETFs.
This part of my Methodology of "Investing Wisely" - I call it "Dissecting" the Market and all its Components. It presents very accurate and valuable weekly Statistics and ( set of ) Odds of the probability of profiting in the current Bullish or Bearish general stock market environment.
You have heard the term "don't buck the trend" many times - - - I suggest that you do not "buck the "Probabilities and Odds" either!
With this "information and data" - - my Probabilities and Odds can easily create a very accurate (Leading) Forecast for the Marketplace, Sectors, Industry Groups, Commodities, Companies and ETFs. This work / analytics is often weeks ahead of my Inflection Point method of Buying or Shorting for each of these 37 Groupings.
Repeating just a bit - - I have 37 such Groupings covering the entire market. If you pause to think about that - - - I know where the Best of the Best (securities) currently resides and where the Worst of the Worst (securities) currently resides. Remember this information is available well ahead of Inflection Points for the Market as well as for the Companies and ETFs. My past performance should demonstrate that the words of this paragraph are a very positive part of Asset Management and "Investing Wisely."
Then - - - It is then just a matter of being highly selective within those Favorable for Bullish and Un-Favorable for Bearish securities within my Groupings and being "disciplined and patient" waiting for Bullish or Bearish Inflection Points. Oh yes, Bullish and Bearish Inflection Points occur only several times per year!
There is no question in my mind and my work / analytics that - - those of you who don't have or use these very special tools are leaving 10% to 15% and more on the table for most all Buy and Short transactions. My asset management objective is to identify securities with a minimum of 20% profit probability for each transaction - - - This has to do with the "PROBABILITIES" and "ODDS." ( Please see my long-term Performance for proof of its effectiveness. I publish my Performance each Monday in my Personal Blog and in SeekingAlpha.com ) .
This Analytics Work is fun for me. It can only be done if you have something like my 37 Groupings to break down (Dissect), first the Sectors and then the component Industry Groups of each Sector and then each component Company / ETF. I use very basic fundamental - valuations that must always be confirmed by my unique technical analysis. My Cycle Analysis and Forecasting Methodology has served both me and my Clients well for over 50 - years.
Simple stated - it works every time! Simple stated, it gives me time to "Cherry Pick" the Best of the Best for Bullish Cycles and the Worst of the Worst for Bearish Cycles. Simple stated, You will profit by becoming a Client.
Fundamental - Valuation is a very mechanical / mathematical process but over the more recent years it has become an art as well as a science. Each Client recommended security goes through a through fundamental valuation and is compared with many peer companies to be sure that my "Cherries" are ripe and succulent.
Risk can be managed and actually quantified (calculated) quite easily when you have the tools and experience. I have those tools and many years of experience of using them wisely to profit. Computing the "threshold of risk" is also essential if you want a profit to loss ratio of 90+% or better.
Technical Analysis for me is very different than what you are being lead to believe is accurate measures of securities - it's / they're - NOT! Formulas and Systems DON"T WORK - either! This was proven conclusively in my required doctoral studies. For me it means use - Cycle Analytics and this is a very accurate approach identifying Bullish and Bearish Primary and Secondary Inflection Points for the General Market, Sectors, Industry Groups, Commodities, Companies and ETFs. My doctorate thesis was on business and securities Cycles. That work has been very good to me for many decades.
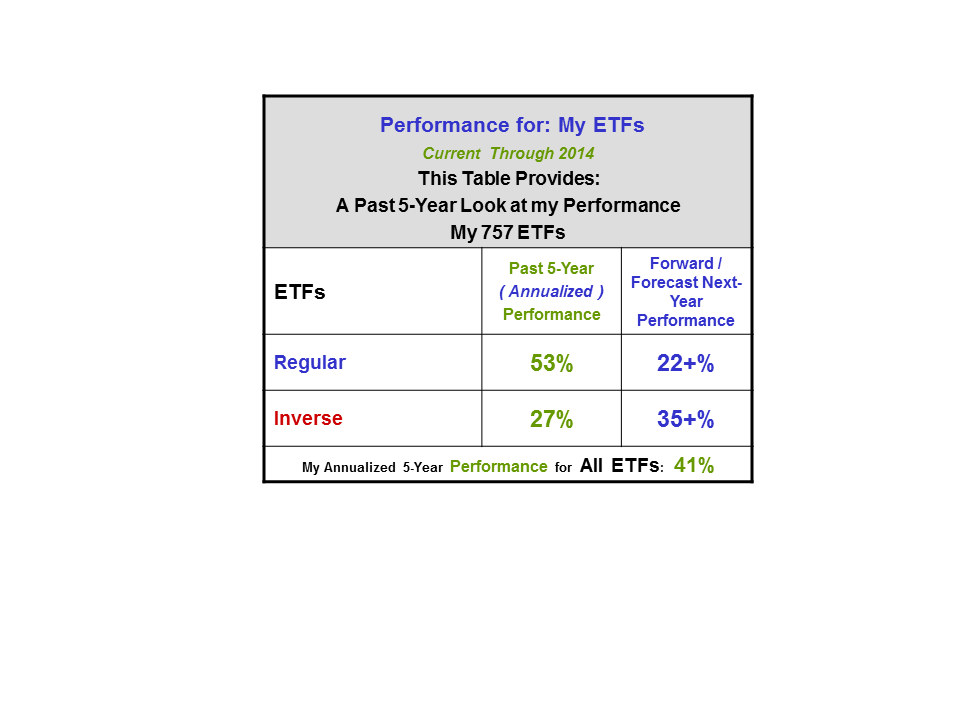
Table I of Past 5-Year Performance and Forecasted Performance for the Coming Year
You can stop here in reading this article and just try to take advantage of this table. However, if you really want to profit the balance of this and my weekly articles are designed to teach and share with you - - Why Most Investors Lose Money ( or do not maximize their investment opportunities ) in the Stock Market.
Unfortunately, the above percent figures are dynamic and you are seeing only the very tip of the ice-berg! That means they are changing, sometimes improving and other times they are declining. Obviously, only I have sufficient historic data to know the difference. There is much more than meets the eyes in "Investing Wisely" - I hope my articles share that point clearly. If not - just ask.
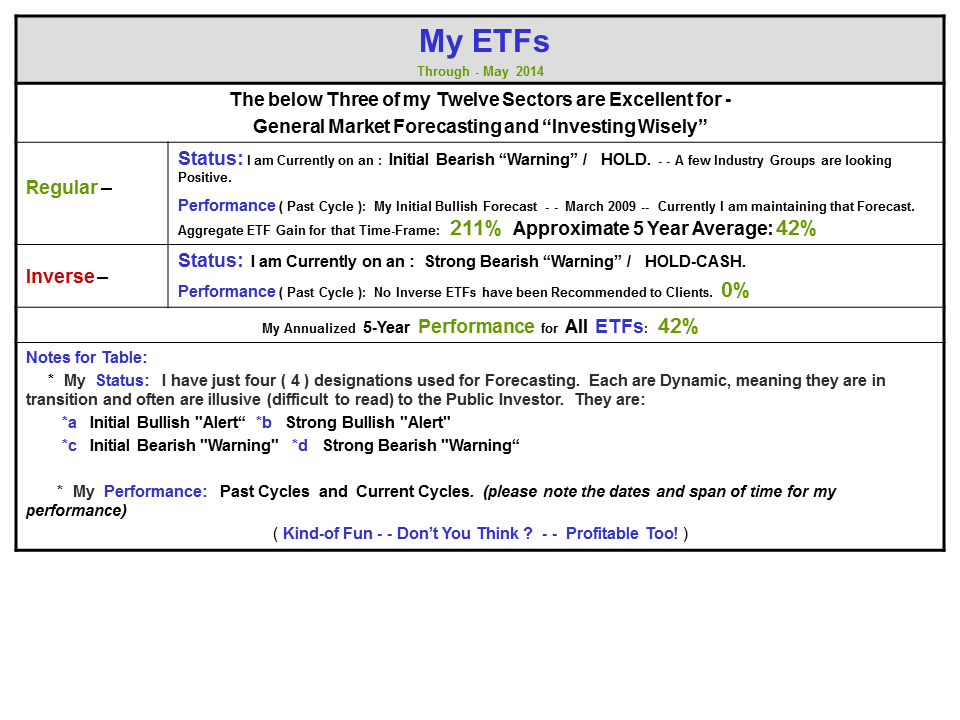
Table II of Current Status and Performance for: Technology / Transportation / Utilities Sectors
It has NOT always been like you are being told by so many bloggers and even true financial analysts who do not take the time to do their homework and "Invest Wisely." Every Sector, Industry Group and ETF has taken some big hits over the years.
Retired Investors who focus on Dividends: Maany ETFs pay a decent dividend. Those ETFs have NO GREATER RISK than do Utility Companies. I hope you are listening!
I have not ever taken "Big Hits" because of work / analytics like I am sharing herein. My profits are superior to any competitor with a conservative philosophy of "Investing Wisely."
The "Probabilities and Odds"
I present the "Probabilities and Odds" of your profiting in the stock market in a very unique way. As the Stock Market endlessly Cycles from Bullish to Bearish and then back to Bullish again - - ALL securities Cycle, within their own realm, Rotate (in an endless loop) from "Favorable" to "Un-Favorable" to "Also - Rans." This is true of my 12 Sectors I share with you and my 25 other Groupings. You can read the percentage figures below and that should tell you, that unless you have the "Odds" with you are gambling just as if you were in a Casino. In plain English - - Wall Street Has - - FIXED - - the ODDs and they are not even close to being in your FAVOR. Yes, there times when they are but Wall Street - - Will NEVER Tell YOU - - - When.
It is this "endless loop" that is easily calculated and quantified. This can be calculated and quantified for ANY grouping or category of security and therefore present specific "Odds" for each component security (Company) as to the "Probability" of Profiting. Unfortunately, few Investors (financial analysts included) are willing to take the time (or even know how) to learn how to profit from these "Statistics" and "Odds" and therefore always leave a very large amount of profits on the table and not in their / YOUR portfolio.
It certainly makes sense to me that we should invest our money where the Statistics and Odds are favorable and avoid investing our money where the Odds are Un-favorable or "Also-Rans." I Hope This Makes Since to YOU ?
Table III - It's YOUR CHOICE - My Table of the Probabilities or Odds
The following Table should tell you a very compelling story, if not you will always be a disappointed investors taking less than you deserve. Unfortunately, this table also takes time to understand. Take that time and perhaps ask questions of me via Email.
Here are a few of My Suggestions for You to Ponder:
"Investing Wisely" requires that I have a large and historical matrix of Probability Data from which I can calculate the "Odds" and hence the true Risk / Reward Ratio for each and every Company and ETF before investing. Saying it another way - - This work / analytics also provides the remarkable ability to calculate the percent profit potential for each security I may be considering for recommendation to my Clients BEFORE investing .
Here are some suggestions to Ponder. A 20% profit potential is my minimum. a) these three Sectors are basically deteriorating when correlated with my previous (historic) data archive. Only when the Favorable is above 50+% due I consider that Sector or (Grouping) having any prayer of producing reasonable profits in the foreseeable future. Conversely, this means that to take short positions in a Bearish environment I want the Un-Favorable to be over 50+%. In addition, sometimes my Grouping will temporarily bounce above 50%. It is Most Important to - interpolate - this data with previous data to see that it is not an abortion; b) When the above "LOSER" figures ("Un-Favorable and "Also-Rans") are clearly 50+% in control - percent wise you have little chance of profiting and - That's Un-Acceptable Odds - - (please re-visit my above supporting tables); c) numbers, raw data, statistics and odds don't lie, it is always the author / blogger that so often does so - hopefully unknowingly or naively. None the less, you are the one who has to decide who to follow and who to decline to follow - - the difference is spelled - MONEY / PROFITS; d) May I suggest that you will begin to benefit (Profit Consistently) if you will accept and perhaps question what I am sharing with me by Email.
It is all simple math from my work / analytics over many, many years.
Caveat: I do not publish these figures frequently enough for you to use them to help make your investment decisions. Please Don't! As you know I preach "Selectivity" in many of my articles. There are always far fewer profitable securities than you might tend to believe.
Here too my matrix of Probability Data, Fundamental Analysis and unique Technical Work is ALWAYS going to be at least one percent more accurate at Buying/Selling and Shorting/Covering time-frames than yours. Hum - one percent just happens to be my average professional asset management fee. Think about that!
Forgive me for offering the following - Overly Basic Words - for further support of my Probabilities of the Statistics and the Odds:
First of all the "Favorable" Companies and ETFs to work with for Buying long within my Universe of over 3,000 Companies and 200 ETFs - - there are less than 5% of those Companies and ETFs that meet my Upside Minimum of 20%. My current "Odds" are not beginning to support holding other than very select Companies (fewer and fewer each and every week) and certainly does not support holding most Mutual Funds. (please see my daily Company Articles for those 46 Companies that I am Holding and those that I am Holding Cash - it is there everyday in my Personal Blog); ( The opposite is true for my "Un-Favorable" Companies and ETFs ).
This simple mathematic formula holds true with all the above-mentioned Sectors and my 37 Groupings)!
Second, It is mandatory in my asset management to keep a close watch on each of my large Groupings of securities, for what I call "Loss Control." This task clearly offers an excellent insight into both what Companies / ETFs are moving into Favor and those that are moving out of Favor - remember they are ALL Rotating. Stop Losses never have been a prudent way to invest, at least for me. Yes, this is a very dynamic marketplace. I hope you will want to visit with me via Email and ask questions. And Hedging any Investment or Portfolio is just telling you that the financial analyst / portfolio manager does not know what he or she is doing;
Third, Please understand I have much more data to work with than what I share or present in my articles / publicly and I definitely "Know when to Hold and Know when to Fold."
Table IV - Current Loser Ratio by Percent
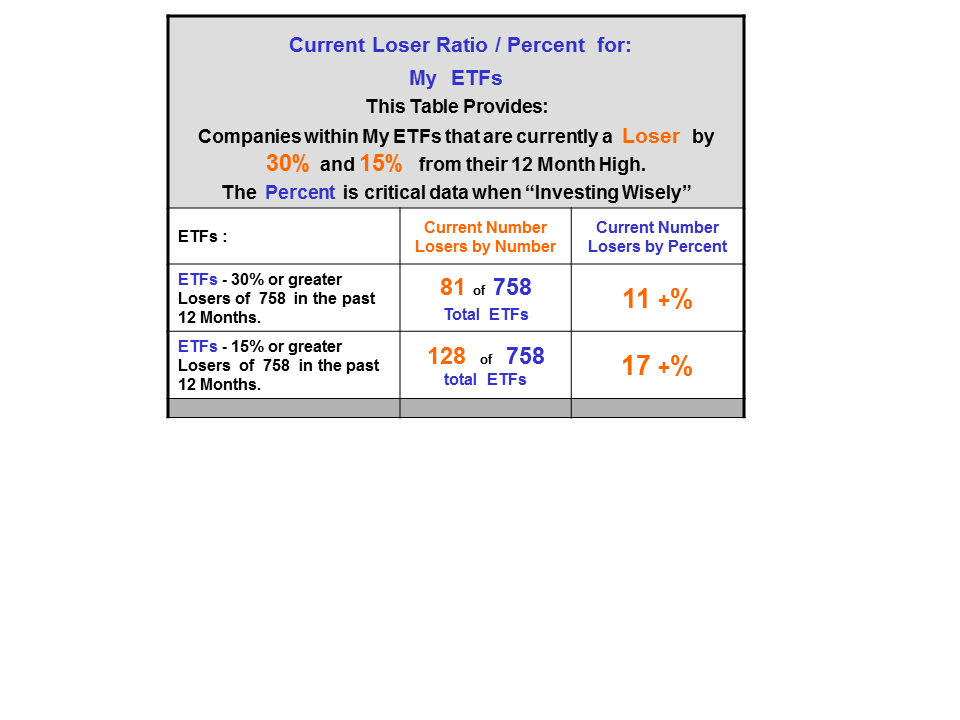
It may surprise you to know that my focus for decades is on the "LOSERS." Greed and a focus on the Winners is fine but Profits come from knowing the difference between the Winners and the Losers. It is simple - a) Eliminate the Losers and you have the Winners; b) Identify the winners by knowing and understanding both their fundamentals with their valuation and probability for profit. I believe Valuation is a lost art and few know how to do that job well; c) Employ a proven and decade tested technical / cycle analysis - - that's a big part of my Very Old and Well Tested - Methodology; d) and - Voila, you have a consistent Methodology for profiting in the stock market.
Appealing to Your Greed - naturally with a Smile
It is my intent in all of my articles to let you know I am seeking new Clients for a bit more time - then I will go dark. My Followers and Clientele is growing very nicely and I will never again become a large (un-manageable) asset management company - ever again. Back in those days (when it was) my profits were good but now they are superior and consistent. That is gratifying to say the least!
I believe what I have shared above is both a Unique and very Profitable part of my Methodology of "Investing Wisely." If you will take the time to understand what I perfected many years ago, you will agree that my "Cherry Picking" makes sense and will add ten - fifteen or more percent of profits and to your annual bottom line - often to each transaction.
Retired / Income Investors: I have read the books and thousands of Financial Blogs just like you have or do. I answer, often in detail, Emails many times per week. After all of these years, I still have not come across any author or investor who understands that ALL of the Component Securities for these three and all my total of twelve Sectors, and 25 Groupings most often pay a quarterly Dividend. Kind of Simple - Huh?
Identifying Companies and ETFs that pay a Dividend is Child's-Play and an absolute no Brainier and yet the articles continue to flow with the focus solely on Dividends. Yes, Of Course and With-Out-A-Doubt (Dividends) are important but owning or holding a Company that is "Projected" or "Forecast" to descend in price is just beyond my ability to understand. I read such articles each day. May I just say, I can help. . .
My Logic Suggests
It is better to have private professional guidance and direction for your portfolios - and - pay one percent of the value of your portfolios to a seasoned professional and outperform the averages by 10% to 15% and more - - than to - - disregard the value of the above Methodology of "Investing Wisely"- - or - - use more expensive / poor performing and impersonal mutual funds.
Summary
At this writing these / my ETFs are suggesting that the very old Bull General Market is notable deteriorating. Topping a long-term Bull Market is always a slow process of that requires much patience and discipline. Doing your homework and gaining perspective each day / week helps more than you might think. This is especially true if you have a multi-decade seasoned asset management methodology at your finger-tips. I DO !
Of my 758 ETFs, currently many are currently Losers, and many more are on the edge of becoming Losers. For reference, just six months ago there was far fewer Losers. Of my other 36 Groupings the picture is much more Bearish. My Forecasts suggest that within the next six months, perhaps less, a notable number, definitely not all, of my Sectors will become Losers.
It is simple mathematics with a few caveats, when there are mostly Bullish Sector, Industry Groups and Companies you have a Bull market. It should be somewhat obvious that when, "vice-versa" occurs your have a Bear market. The latter is in the making.
The trick is knowing the Bulls from the Bears! I do that task very well because I actually live with those critters. As this never ending process occurs, Indices ( INDU, Nasdaq, S&P, etc.) will be taking hits or pull-backs that will clearly confirm to you that a Bear Market is in the making. This has been occurring for many months now!
I sincerely hope you conclude that having an archive of all this (Favorable / Un-Favorable / Also-Ran) data is an extremely valuable resource. One that provides direction and guidance to me as the analyst and for you to invest exclusively where the probabilities for future profits are.
You might want to read my daily Company articles and their rather long archive for proof of my management skills - - on: (AAPL), (GE), (GOOG), (AMZN), (CSCO), (GLD), (MSFT), (SLV), (T), (XOM). ( There are a total of 46 Companies and ETFs including the entire Dow 30 )
| Note: Should you have interest in my professional guidance and direction for your Portfolios, please Email Me with your questions or thoughts: senorstevedrmx@yahoo.com. For Daily Updates and a Deeper View into my work / Analytics, you might want to Click and Scroll Down to my "Thumb-Nail" Articles within my personal blog. Please spend some time reading my articles for a perspective of their and also viewing my Bio before making inquiries. Sharing a bit about yourself and your financial and needs, goals and objectives would be appreciated. A relationship between You and Your Asset Manager must be a "Win / Win" affair. You get the Performance and the Education and I get paid for my Analytics / Work and Experience. |
Smile, Have Fun, Investing Wisely,
Dr. Steve
AAPL, GE, GOOG, AMZN, CSCO, GLD, MSFT, SLV, T, XOM, SPY, QQQ, DIA, SPY, QQQ, DIA