The
SPDRs Select Sector Financial ETF (XLF) has broken down out of a bearish descending triangle formation closing last week at $15.77. XLF closed right at potential support of the 200 day exponential moving average (ema), 50% retracement of the uptrend measured from the late November 2010 low (light blue), and the 38.2% Fibonacci retracement level of the uptrend measured from the late August 2010 low (purple).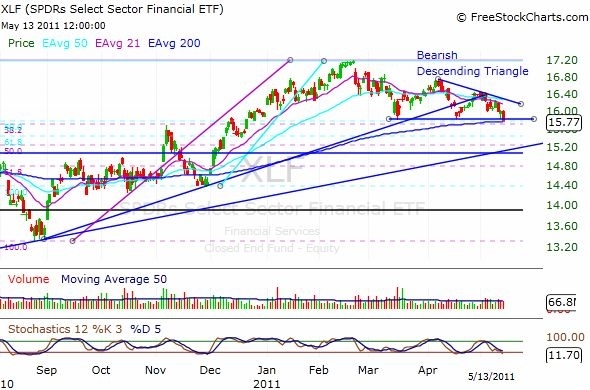
Bearish confirmation will come on a close below these indicators, with $15.71 being the low price (38.2% Fib). A pullback from here could create a new short entry setup.
Another way to play the weakening of financials is with the
ProShares Ultra Financials (UYG), ProShares UltraShort Financials (SKF), and Drexion Financial Bear 3x Shares (FAZ). All have 50 day average volume of greater than 1.5 million shares.The chart on the ProShares Ultra Financials (UYG) shows a bearish breakout of a symmetrical triangle formation. UYG broke out on Thursday with follow-through to the downside on Friday.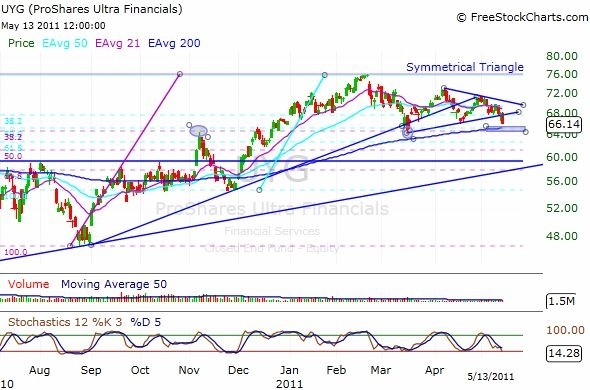
There is a strong potential support zone close by where UYG could bounce to test resistance of the triangle (previous support) before continuing lower. The change in trend along with the triangle breakout should provide enough downside force for UYG to trend below this support zone.
This support zone is identified by the bottom of the triangle ($64.31), previous resistance from November 5, 2010 ($64.43), confluence of two Fibonacci retracement measurements, and the 200ema ($65.08).
As an alternative to shorting the two ETFs discussed above, one could look to go long the reverse ETFs, SKF or FAZ.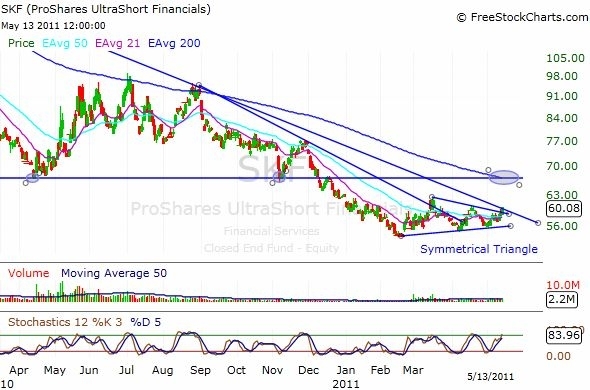
The chart patterns for each are similar showing very clear bottom symmetrical triangle formations. Each is now trading above their 50ema’s on the daily charts. (www.etf-portfolios.com)