After analyzing the performance of Abercombie & Fitch Co. (ANF) I wanted to find out how efficiently ANF is employing its store space and to compare its performance with performance of its competitors such as American Eagle Outfitters (AEO), GAP (GPS), Buckle (BKE), Aeropostale (ARO), Nordstrom (JWN) and Ross Stores (ROST). So first of all I will look into individual usage of space of each the companies and then I will conclude with the comparison between them.
Abercombie & Fitch
In fiscal year 2012, ANF operated 1051 stores with the total space of 7,958,000-square feet. The average space for a ANF store was 7,571-square feet. In 2012, ANF's total revenue was equal to $4.51 billion. The average revenue per square foot was equal to $479.
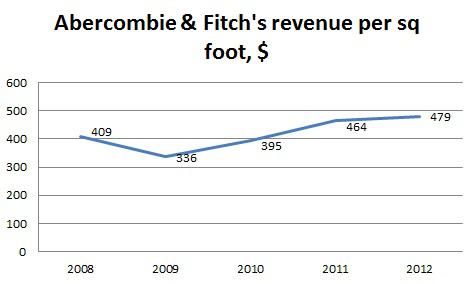
In the picture above you can see revenue per square foot measured in dollars in the last five fiscal years. Although ANF suffered a decrease in revenue per square foot in 2009, it managed to recover it in 2011 and increase further to $479 in 2012. Since 2009 ANF has increased revenue per square foot by 14.6%.
(All data provided above has been taken from ANF's Annual Reports available at Abercombie & Fitch's official website.)
American Eagle Outfitters
At February 2, 2013, AEO operated 1044 stores with the total space of 4,962,923-square feet. The average space for AEO store was 4,753 square feet. In 2012, AEO's total revenue was equal to $3.47 billion. The average revenue per square foot was equal to $489.
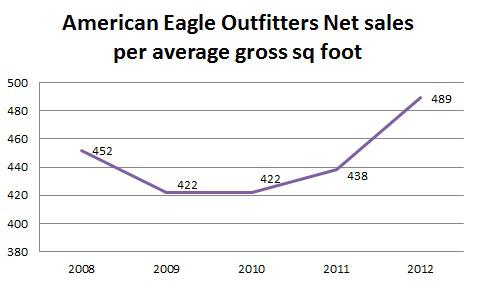
AEO had a setback in revenue per sq foot in 2009 when it decreased by 6.6%. 2010 follows as a year of stabilization but afterwards AEO managed to grow the revenue per sq foot till in 2012 it reached $489 which is 15.8% increase comparing to 2009 and 2010 and 8.1% increase comparing to 2008. In 2012, AEO had net income of $232.1 million and sharply increased dividends from $0.44 previous year to $2.05 per share in 2012.
(All data provided above has been taken from AEO's Annual Reports available at American Eagle Outfitters official website.)
GAP
As of February 2, 2013, GAP operated 3,407 store locations with the total space of 36.9 million square feet. The average space for GAP store location was 10,830-square feet. In 2012, GAP total revenue was equal to $15.6 billion. The average revenue per square foot was equal to $364.
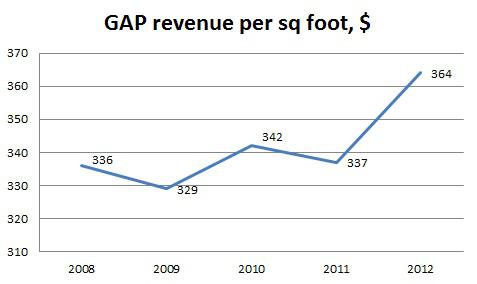
GAP revenue per square foot has been fluctuating from $336 in 2008 to $337 in 2007, basically moving sideways. Finally, in 2012 GAP managed to break the trend and increase revenue per square foot by 8% comparing to the previous year. GAP continued the increase of dividends paid out and in 2012, it reached $0.50 per share.
(All data provided above has been taken from GAP's Annual Reports available at GAP official website.)
Buckle
As of February 2, 2013, Buckle operated 440 store locations with the total space of 2.63 million square feet. The average space for Buckle store location was 5,378-square feet. In 2012, Buckle total revenue was equal to $1.12 billion. The average revenue per square foot was equal to $475.
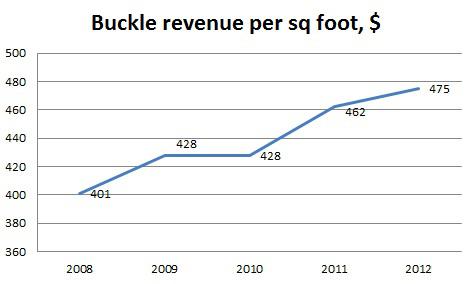
Buckle shows quite terrific performance in regard of increase the revenue per square foot. Although the revenue per square foot stalled during 2010, in 2011 Buckle showed significant growth, which slowed down in 2012 reaching $475 revenue per square foot which is an 18% increase comparing to 2008.
(All data provided above has been taken from Buckle's Annual Reports available at Buckle official website.)
Aeropostale
In fiscal year 2012, Aeropostale operated 1084 stores with the total space of 4 million square feet. The average space for an Aeropostale store was 3,703-square feet. In 2012, Aeropostale's total revenue was equal to $2.38 billion. The average revenue per square foot was equal to $538.
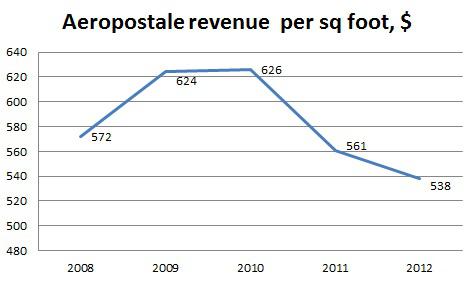
If in the middle of the crises and the economic slowdown Aeropostale showed good results then already in 2011 it suffered sharp decrease in revenue per square foot and 2012 didn't differ from 2011. In 2012, revenue per square foot has fallen to $538 which is a 14% decrease comparing to 2010 and 6% decrease comparing to 2008. Net margin has decreased from 9.6% in 2010 to 1.5% in 2012 as well as earnings per share has decreased from $2.49 to $0.43 respectively.
(All data provided above has been taken from Aeropostale's Annual Reports available at Aeropostale official website.)
Nordstrom
In fiscal year 2012, Nordstrom operated 240 stores with the total space of 25.2 million square feet. The average space for a Nordstrom store was 105,375-square feet. In 2012, Nordstrom's total revenue was equal to $11.7 billion. The average revenue per square foot was equal to $470.
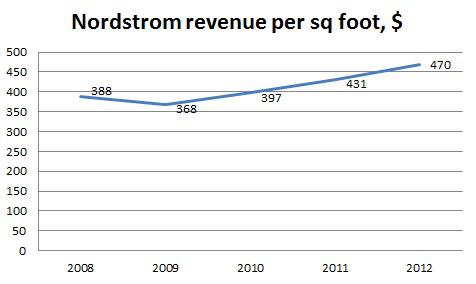
As it can be seen in the graph above, Nordstrom has done quite good job and has managed to increase the revenue per square foot from $388 in 2008 to $470 in 2012 which is a 21% increase. During the same time period, Nordstrom has increased net income from $401 million to $735 as well as increased dividends from $0.64 per share in 2008 to $1.08 per share in 2012.
(All data provided above has been taken from Nordstrom's Annual Reports available at Nordstrom official website.)
Ross Stores
In fiscal year 2012, Ross operated 1,199 stores with the total selling space of 27.8 million square feet. The average space for a Ross store was 23,185-square feet. In 2012, Ross's total revenue was equal to $9.72 billion. The average revenue per square foot was equal to $355.
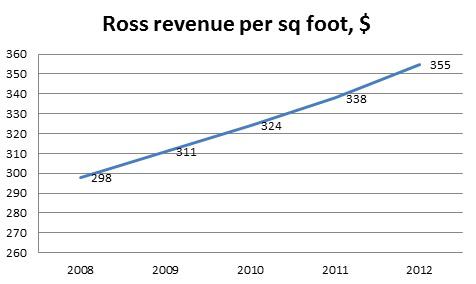
Ross has been doing a good job, as well. The company increased it's revenue per square foot from $298 in 2008 to $355 in 2012 which is a remarkable 19% increase. Also, Ross Stores has increased it's net margin from 4.7% in 2008 to 8.1% in 2012 as well as dividends per share from $0.198 in 2008 to $0.59 in 2012.
(All data provided above has been taken from Ross Stores Annual Reports available at Ross official website.)
Comparison and Conclusion
Revenue per square foot in itself is a comparison tool, and if we consider plain numbers then the most efficient use of store space is shown by Aeropostale with revenue of $538 per square foot and the least efficient use is shown by Ross Stores with revenue of $355 per square foot. There arises some contradictions from other point of view - Aeropostale had considerable decrease while Ross Stores had a significant increase in revenue per square feet.
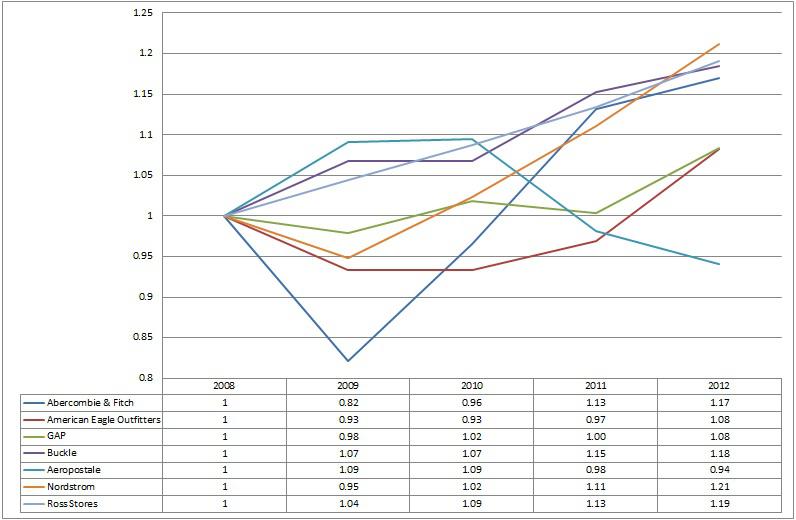
So I compared the changes in revenue per square foot by applying value of 1 to 2008 data and multiplying in by yearly change onwards. By comparing these results, the company that is putting in the most effort to increase its efficient usage of space is Nordstrom which is closely followed by many others. The company that had the worst results in this comparison is Aeropostale.
In conclusion, answering to my question with which I started, it can be said that Abercombie comparing to its competitors is fairing quite well. Also, companies that are worth a look into them are Nordstrom, Ross Stores and Buckle.
Disclosure: I have no positions in any stocks mentioned, and no plans to initiate any positions within the next 72 hours. I wrote this article myself, and it expresses my own opinions. I am not receiving compensation for it (other than from Seeking Alpha). I have no business relationship with any company whose stock is mentioned in this article.