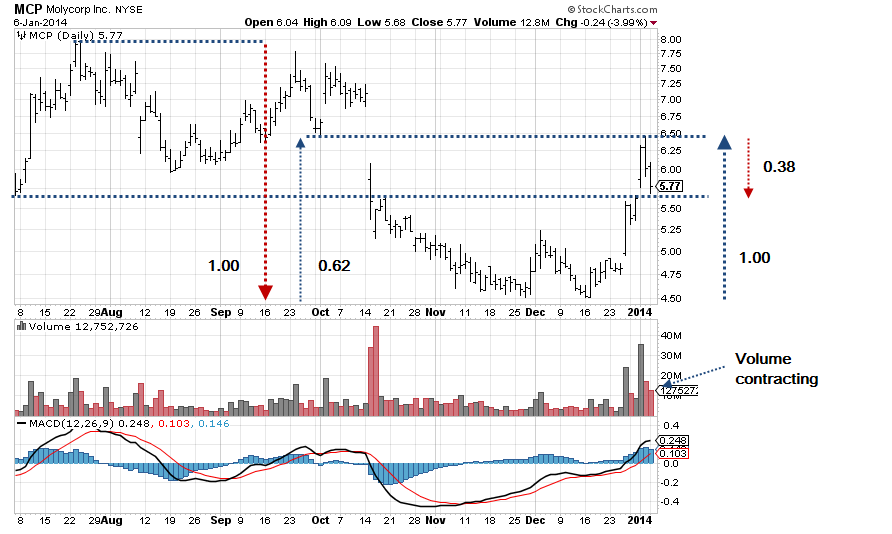
The daily chart below shows that Molycorp Inc. (MCP) has retraced 38% of the total distance from the all-time low.
Charts by StockCharts.com
If the 38% level holds and does not degrade to 50% or more, then the expectation for a continued move higher is reasonable.
It is interesting to note that the chart shows two Fibonacci retracements. One is a 62% retracement of the move from the 8.00 level to the lows, in addition to the 38% level just discussed.
Thus we have two indications that point to higher prices.
A 62% retracement indicates weakness in the move that preceded the retracement (in this case down). The 38% retracement indicates strength in the move that preceded the retracement (in this case up).
Volume has contracted on the session as the price action retraced. This is also a good indication that selling or supply is dissipating.
We may see a continued move up from here or the beginning of a trading range.
As stated in this report, our stop is located far enough away to not be hit with noise and at a level that would indicate the MCP bullish set-up has failed.
Disclaimer:
This report is for discussion purposes and contains our opinions only. This posting is to publicly document our thinking and market analysis actions within the Three Ten Trading entity. The data was obtained from sources believed to be reliable. However, we make no guarantee as to the accuracy of that data.
Investing or trading in equities, futures or options may result in a significant loss of capital, total loss of capital or a loss greater than available capital.
We are not advocating any stock or in any way offering portfolio management advice or stock selection service.
Respectfully,
Paul Mosgovoy, President: Three Ten Trading, LLC
Thank you for reading.
Disclosure: I am long MCP, .