The zweigh breadth thurst has fied again. Developed by Dr. Martin Zweig, the Breadth Thrust Indicator measures market momentum. The Breadth Thrust is calculated by dividing a 10-day exponential moving average of the number of advancing issues, by the number of advancing plus declining issues.
A "Breadth Thrust" occurs when, during a 10-day period, the Breadth Thrust indicator rises from below 40% to above 61.5%. A "Thrust" indicates that the stock market has rapidly changed from an oversold condition to one of strength, but has not yet become overbought.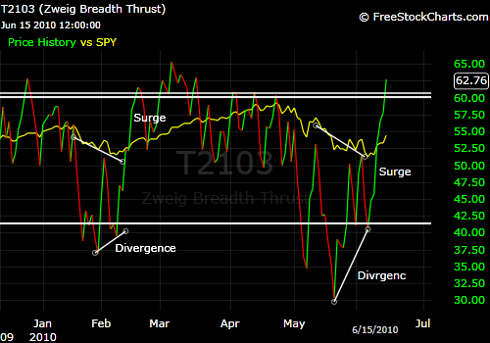
Zweig Breadth thrust fires again.
Seeking Alpha's Disclosure: Past performance is no guarantee of future results. No recommendation or advice is being given as to whether any investment is suitable for a particular investor. Any views or opinions expressed above may not reflect those of Seeking Alpha as a whole. Seeking Alpha is not a licensed securities dealer, broker or US investment adviser or investment bank. Our analysts are third party authors that include both professional investors and individual investors who may not be licensed or certified by any institute or regulatory body.