Over the summer we added a simple multi-wave filter to our benchmark method to further improve on our trading plan.
Having read Elliott Wave Principle several times over the years, the new filter looked an awful lot like miniature versions of the 5 wave cycle that RN Elliott built his famous theory on. What I also noticed about the pattern was that yes it was scalable - fractal in nature - but much more so on the lower time frames, not noticeable on the higher time frames. I had made that same observation years before which is why I had never incorporated it into a trading plan. Seeing the cohesion of the waves on the micro and super micro time frames, and in the same direction as the collective pattern of our own Risk Tolerance Threshold Ratio "really blew my mind", to quote Eric Burdon of the band War. (An RTT Ratio is a yardstick for measuring individual price patterns based on a tenet of Dow Theory, and is the cornerstone of our benchmark method.)
An example of this is seen in the two figures below. Figure 1 demonstrates an 8 wave E.W. pattern in USDJPY last Friday - 10/18/2013-- fitted nicely into the RTT framework. The RTT levels are the green horizontal lines that mark the border that needs to be breached to shift a particular pattern from bullish to bearish. Figure 2 is the actual RTT Ratio for USDJPY on that same day. Given this is such a short-term chart we would only be trading off the collective pattern of the bottom 3 time frames: the 5 thru 20 day patterns - the collective pattern = the majority of patterns.
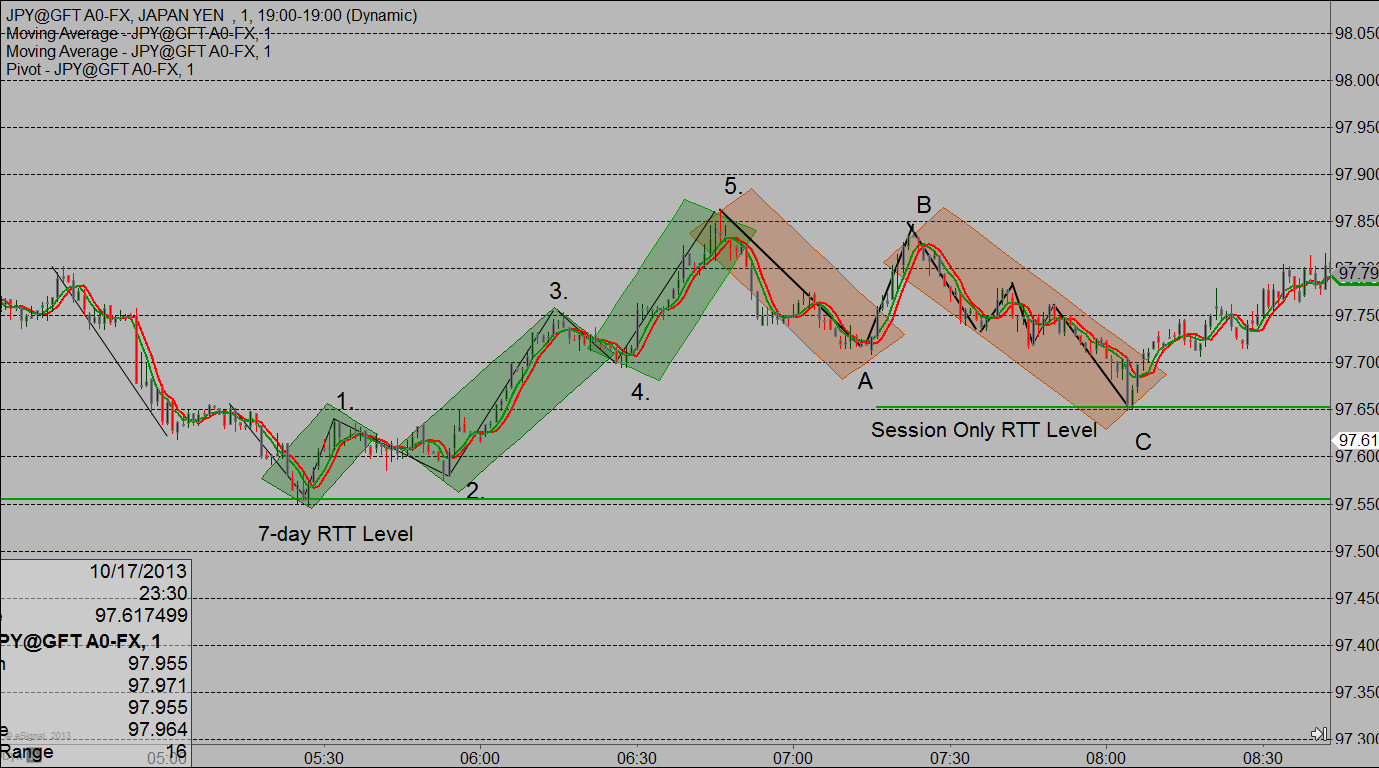
Figure 1. EW Pattern in USDJPY on 1-min chart in RTT Framework
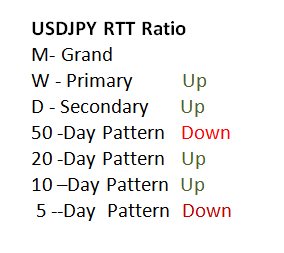
Figure 2. RTT Ratio for USDJPY on 10/18/2013
Seeing the same if not very similar patterns evolving day in, day out, on the intraday charts. in line with the collective pattern identified by the RTT Ratio led me to two conclusions, each supporting the two theories mentioned. One, those most active of traders, professionals who trade intraday, every day, i.e.: house and independent market makers, are well aware of just how far they need to back price up to scare speculators out of positions a.k.a. Risk Tolerance Threshold Theory; and two, that cycle of human fear, need, and greed that creates Elliott's now familiar pattern is alive and well.
While many Elliotticians focus on longer-term charts to fulfill that powerful urge to figure out the big picture, participants in the not-so-nice world of professional trading take advantage of those same patterns on the lowest of time frames. A full 95% of financial futures volume is day traders - the vast majority of professional traders, or their computers, make decisions not on daily or hourly charts, but on tick charts. Why .618 still proves a reliable retracement level today has less to do with universal psychology and everything to do with professional traders and programmers front running each other as they seek to buy in the lower 3/8ths or 1/3rd of the previous range in an uptrend- be it a tick chart, or a 5 or 10-minute chart- or sell in the upper 3/8ths of the previous range in a downtrend.
But that does not mean that professionals are not familiar with wave patterns. But they do not look for the degree of geometric perfection displayed in book examples, and they fully understand that markets reset themselves after significant new events, or time barriers such as a weekend, which means those short wave patterns start over as well. They also approach markets from a trader's perspective which is more similar to an odds maker than an analyst trying to forecast the future.
Elliotticians insist that any analysis that deviates from the rules already set forth in Elliott's original works or Prechter's work are not Elliott Wave, which I suspect does us a disservice. From an evolution standpoint it seems very unscientific to make such a declaration. The only goal here should be profitable trading. I assure you market makers find the idea of Elliotticians trying to defend the sanctity of their rules relative to what happens in a live market humorous. After all, the largest gains do not always come for whomever had the initial idea, but for those who improve on that idea.
What is interesting to me about Prechter's book Elliot Wave Principle is the original letter in the beginning of the book where R.N. Elliot petitions Charles Collins, the Publisher of Investment Counsel, citing how the 3 features of market action which Elliot has discovered are in his words "a much needed complement to the Dow Theory". This makes perfect sense to me because I see the familiar 5 wave pattern being a very good compliment to RTT Theory, which is itself based on Dow Theory. The RTT Ratio provides the market direction to trade and the actual levels to look for buy or sell signals, while a basic knowledge of Elliott's work helps nicely with timing and confidence.
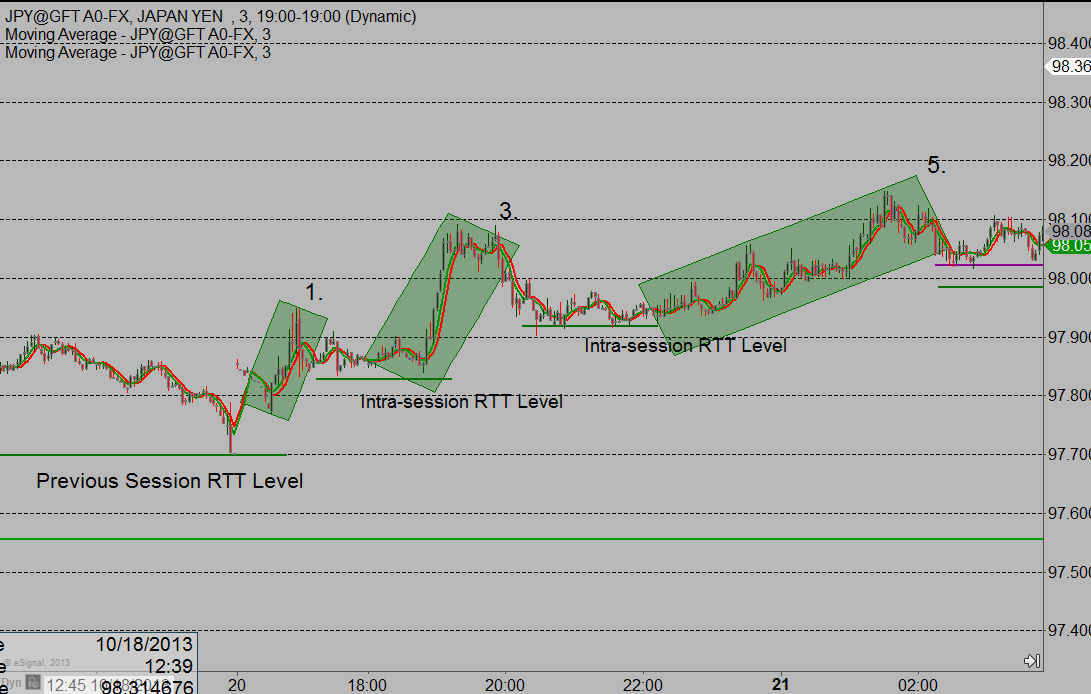
Figure 3. Simple 5 Wave Pattern in-line with the RTT Ratio
Another example of this can be seen in Figure 3 which is again USDJPY, on Sunday evening - 10/21/13 -- the session following the chart in Figure 1.
The thing to remember about trading is you have to accept risking your money on every trade. And regardless of how good the method you use, you run the risk of having your own thoughts and feelings overrule your method. Elliot Wave itself is a fascinating analytic study, but you may gain more confidence and success by using a framework such as RTT Theory to identify trade direction and entry price before looking for those familiar waves.
To see Jay Norris highlight trade set-ups and signals in live markets using RTT Theory on Mondays & Thursday's for free during the London/U.S. overlap go to: Live Market Exercise. Jay is the author of "The Secret to Trading: Risk Tolerance Threshold Theory".
Trading involves risk of loss and is not suitable for all investors!