Talking Points:
*The Fractal Nature of Markets
* Applications of the Phenomenon
* Statistical Validation
The most important technical tenet in trading is straight out of Dow Theory and says that a market can retrace up to 2/3rds of an impulse price move and still maintain its primary pattern. The 2/3rds retracement is the most important level on the chart. It is effective not just for long-term patterns, but the short-term and micro patterns also. This tendency is highlighted in these current charts of the Euro, U.S. Dollar Index, crude oil and gold in Figure 1, 2, and 3.
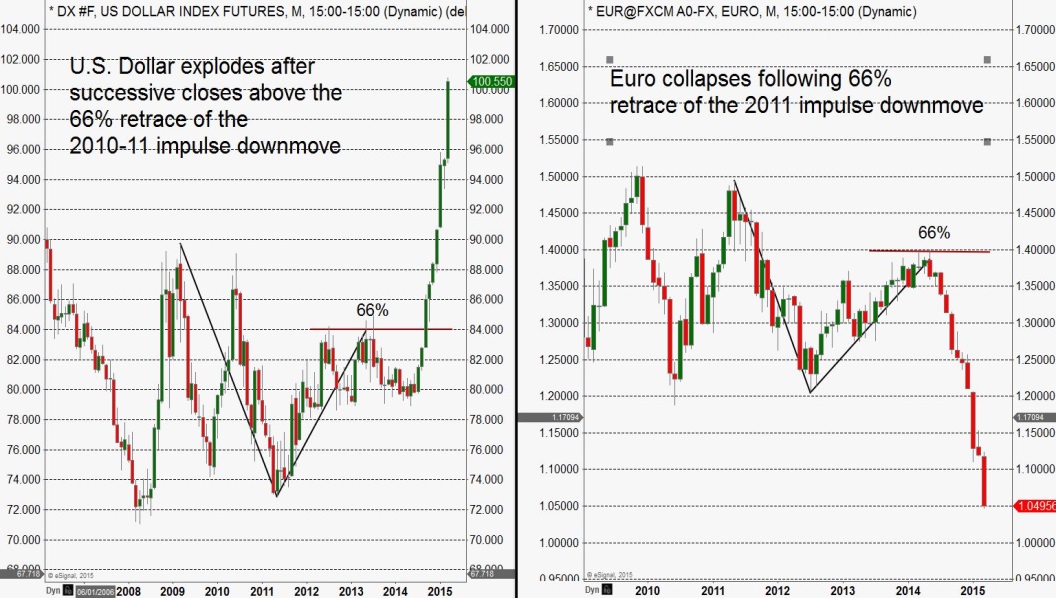
Figure 1. Euro and Dollar Index futures
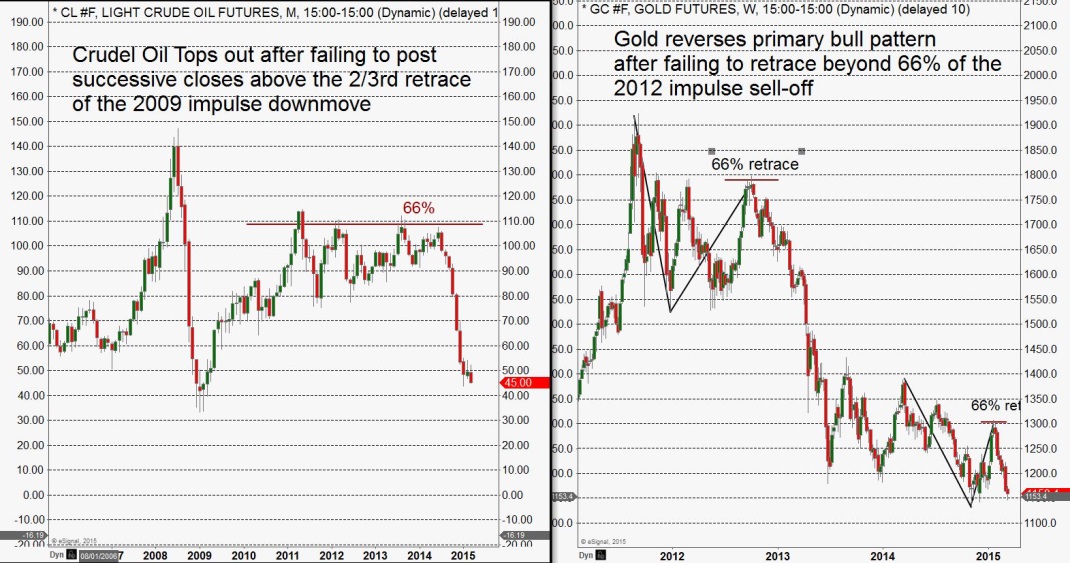
Figure 2. Price Charts of Crude Oil and Gold
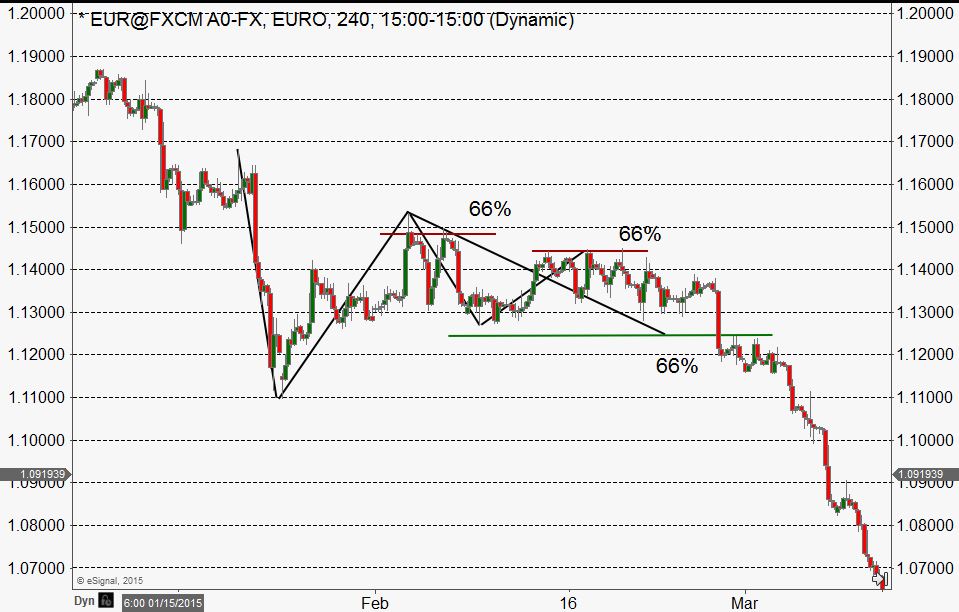
Figure 3. 2/3rds Retracement Patterns on Intraday EURUSD Chart in February 2015
This trading tenet is as important now as it was when Robert Rhea wrote about it over 80 years ago in The Dow Theory. And focusing on buy and sell signals, at these key levels, dovetails with the golden rule of trading: "buy dips in uptrends, and sell rallies in downtrends". No doubt underlying fundamentals determine a markets predominant trend, and that is always the direction we want to trade in, but it is these 66% counter-trend price dips and rallies that cause the majority of retail traders to lose, and provides market-makers and professionals a living.
The Fractal Nature of Markets
We have a theory for this collective behavior called Risk Tolerance Threshold Theory, but we know most traders are not as interested in the behavioral science and academics of this phenomenon as they are in the practical application: successful trading. Before we focus on those applications however, there is one academic subject that will go a long way in helping you to understand how to profit from this market tendency, and that is markets are fractal in nature. "Fractal" means that the same behavior is programmed into the system regardless of the degree, or timeframe, and this behavior is a two way mechanism. So the lower time frame patterns mimic the higher time frame patterns and, the higher time frames mimic the lower time frames. As traders we just need to know that if we have a measurement to determine the current pattern on one time frame then that same measurement will work on all time frames. The 2/3rds retracement is that yardstick. And this same measurement also provides a reliable indication for measuring when a pattern has reversed!
Applications of the 2/3rds Phenomenon
Just as important as the actual support and resistance the 2/3rds level provides, perhaps even more important, is what is implied in Dow's observation: A market can retrace up to 2/3rds and still maintain its pattern/trend; therefore a retracement beyond that level will indicate a pattern reversal. That truism in light of the market's fractal nature gives us the means to be able to measure the pattern on any time frame!
For example, if the high price on the chart came before the low price, and that market has not retraced more than 2/3rds of the difference between those two numbers on a 2 close basis following the low price, that time frame pattern in down --bearish. Likewise if the low price came before the high price, and that market has not retraced more than 2/3rds of the difference of those two numbers on a 2 close basis following the high price, that time frame pattern in up - bullish.
In the gold chart in Figure 4, we have broken the market down into 3 patterns: the 50-day, the Secondary Pattern, and the Primary pattern. We can identify with confidence the direction of those patterns based the high price, low price, and the closing price - fact based occurrences --in proximity to the 2/3rd retracement.
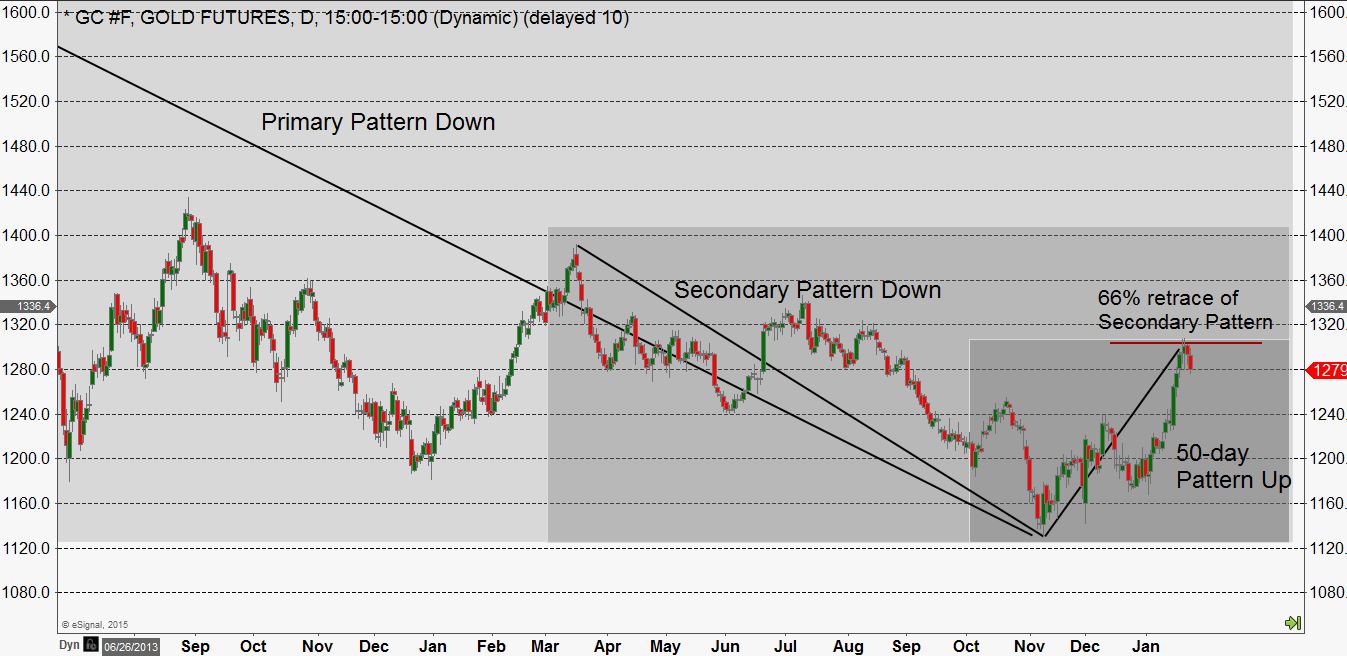
Figure 4. Individual Patterns in Gold market
By taking this same information and plugging it into what we call our Risk Tolerance Threshold Ratio, we give ourselves a much easier to read, objective graphic where we can see at a glance what the current direction of the tradable patterns are -- See Figure 5.
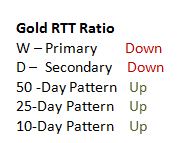
Figure 5. Gold RTT Ratio from late Jan 2015
If you are a short-term trader you would be more focused on the lower time frame patterns and the support and resistance created by them, while a longer-term trader would be interested in the longer-term patterns and levels.
The RTT Ratio gives us an objective tool for determining trade selection because it definitively measures the trading environment we are in: trending or counter-trending, and provides the foundation for a method that is easily validated.
Statistical Validation
We teach that it is not the direction of the individual time frame pattern that is important but the direction of the majority, or collective pattern, that counts. We focus on any 3 successive patterns and trade in the direction of the majority of those three. We have absolute confidence that this collective pattern is a reflection of the influential fundamentals of the day.
The RTT Ratio helps insure that our trade selection --are we buying or selling? -- is aligned with the current trading environment. It also allows us to back-test or forward-test a methodology or tactic to determine if the effort is more effective in a trending market or a counter-trending market. Charles Dow said the hardest thing in market analysis was determining when the market shifted into a counter-trending environment and how long it would last? Our RTT Ratio, which is based on Dow's observations, identifies the trading environment so we can adjust our strategies and filters accordingly. One of the most powerful advantages you can have as a trader is to simply know ahead of time if you are going to be a buyer or a seller.
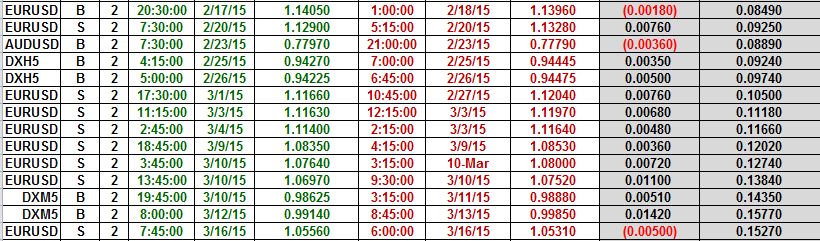 Figure 6. Trading-U's 15-minute Benchmark
The spreadsheet in Figure 6 is our benchmark method's performance on the 15-minute chart for the 30 days prior to writing this chapter. We only took trades that were in-line with the collective pattern at the time of the trade, i.e.: we bought dips in uptrends, and sold rallies in downtrends.
Jay teaches trading at Trading University. To sign up for a free trial of Trading-U's Core Concepts Course and attend a interactive live class where Jay points out set-ups and signals in live markets go to Trading-U Trial and choose the "free trial" option!