This morning. Yesterday’s sharp equity sell-off, the past year’s worst, pushed U.S. equity markets back into correction and ended the briefest of market uptrends after just one day. Notably, NYSE composite volume fell -21.5%, avoiding a distribution day and taking some sting from the decline. Also, the SPX ended +0.72% above its 1305.14 April low, a technical plus. Today, world equity markets are lower. After fair value adjustment, U.S. equity futures are modestly higher. U.S. Treasury yields are little changed. The U.S. dollar is weaker. Commodities markets are mostly higher. After a fair value adjustment of +1.45 points, June SPX equity futures are at 1314.60, up +1.05 points. The SPX opens at 1314.55, -1.35% below its recent April 29 multi-year closing high and +1.45% below its 50-day moving average. The SPX is +3.07% above April’s lowest closing low of 1305.14. Next resistance is at 1349.90. Next support is at 1335.80.
Losses were greatest on the Nasdaq, which ended -2.31% lower, followed by the NYSE, SPX, and DJI, -2.31%, -2.28%, and -2.22%, respectively. Financials were the worst performing market segment, down -3.43%. Disappointing employment and ISM reports triggered the sell-off. Markets gapped lower and the downward trend accelerated after 10:00, when the ISM report hit the tape. Whereas markets had shrugged off disappointing economic reports in recent days, there was no relief rally anytime during the day, and equities ended near their intraday lows. Market breadth was negative. Volatility rose, with the VIX ending at 18.30, up 18.5% from 15.45 the prior day. As noted above, volume declined, avoiding a distribution day. Though institutional selling was apparent, trading desks reported an orderly sale, comprised mostly of long sellers, few short-sellers, and an absence of buyers.
Asian equity markets remain in correction, and the Eurozone uptrend is under pressure. Earlier today, the Nikkei closed down -1.69%, on a +5.88% increase in volume. Utilities ended higher. Consumer services and health care were lower but were the other best performing segments. Financials were middling performers, closing down -1.92%. In China, the Hang Seng and Shanghai composite closed -1.58% and -1.40% lower, respectively. Trading desks attributed the weakness to the poor U.S. economic reports. On the SHCOMP, volume rose 25.8% from the prior day. The SHCOMP closed at 2705.18, -11.5% below its recent April 18th 3057.33 high, -3.66% below its 2010 close, and below the 2843.25 200-day moving average. However, the SHCOMP closed +1.64% above its 2011 low of 2661.45, set on January 25. On the day, the SHCOMP gapped lower, weakened into early afternoon to a 2676.54 intraday low, but rallied through the afternoon. Basic materials, telecommunications, and health care were the best performing segments. Financials were the worst performing segment, losing -2.22%. In Europe, equity markets are moderately lower, with better strength in financials, telecommunications, and utilities. Consumer goods, oil and gas, and basic materials are the worst performers. The EuroStoxx 50, FTSE, and DAX are lower, down -0.81%, -0.86%, and -1.16%, respectively. On the EuroStoxx, financials are best performing segment, down -0.38%.
Despite sovereign debt and other macro-concerns, LIBOR levels are at their lowest levels since early 2009, well below those seen prior to last year’s sovereign debt crisis. Overnight USD LIBOR fell to 0.12650%, from 0.12700% Wednesday and 0.25188% at year-end. USD 3-month LIBOR declined to 0.25200% from 0.25288% Wednesday and 0.30950% at year-end. The U.S. dollar is lower against the euro, yen, and pound. The dollar, which has trended lower since last June, trades below its 50- and 100-day moving averages, but above its 200-day moving average. The euro trades at US$1.4470, compared to US$1.4328 Wednesday and US$1.4396 the prior day. After a sharp decline in early May, the Euro has risen back above its 50-day moving average. The dollar trades at ¥80.73, compared to ¥80.95 Wednesday and ¥81.52 the prior day. The yen trades better than its 50-day moving average ¥82.10. U.S. Treasury yields are lower, with 2- and 10-year maturities yielding 0.429% and 2.961%, respectively, compared to 0.433% and 2.941% Wednesday. The yield curve widened to +2.532% from +2.508% the prior day. In the past year, the 2- and 10-year spread has varied from a low of +1.959% on August 26, 2010 and a high of +2.889% on February 3, 2011. Commodities prices are mostly higher, with higher energy and precious metals, lower aluminum and copper, and higher agriculture.
U.S. news and economic reporting. Today’s focus is the latest week’s MBA mortgage applications (-4.0% versus +1.1% prior), May ADP Employment at 8:15, revised April construction spending and May ISM manufacturing at 10:00. The ADP report disappointed with a 38K gain in May private employment, below 175K survey and 179K in April, revised from 177K.
Overseas news. In May, Spain’s joblessness fell -1.8% over the prior month. Today, Japanese Prime Minister Kan survived a no-confidence vote in parliament.
Company news/research:
· None.
1Q2011 Earnings. The first quarter’s earnings results have exceeded EPS and revenue expectations. Of the 468 S&P500 companies that reported earnings to date, 72% (336 of the 468) beat operating EPS estimates, versus the historical average of 62%. In aggregate, companies have beat by an average of +7.0% (versus a historical average of +2%). EPS is up +19.7% over the prior year. Though challenged in the current operating environment, 353 companies (75%) reported increased revenues and 316 companies (67%) beat revenue estimates. In the first quarter of 2011, analysts estimate the SPX will earn $24.32 per share, compared to $22.47 and $19.49 per share in 4Q10 and 1Q10, a +8.2% and +24.8% increase, respectively.
With all 24 BKX members reporting, 75% (18 out of 24) beat operating EPS estimates. Bank revenues disappointed slightly (by -0.78% on average), with 58% of BKX members missing estimates. Eleven banks (46%) reported increased revenues over the prior year’s quarter. In the first quarter of 2011, the BKX earned $0.95 per share, a +4.4% increase over 4Q10 EPS of $0.91 and 180% above 1Q10 EPS of $0.34.
Valuation. The SPX trades at 13.2x estimated 2011 earnings (increased to $99.34 from $99.18) and 11.7x estimated 2012 earnings (increased to $112.52 from $112.27), compared to 13.6x and 12.0x respective 2011-12 earnings yesterday. The 10-year average median Price/Earnings multiple is 20.0x. Since the beginning of 2011, analysts increased 2011 and 2012 earnings estimates by +5.0%, and +4.9%, respectively. Analysts expect 2011 and 2012 earnings to exceed 2010 earnings ($84.78) by +17.2% and +32.7%, respectively.
Large-cap banks trade at a median 1.44x tangible book value and 12.3x 2011 consensus earnings, compared to 1.49x tangible book value and 12.9x 2011 earnings yesterday. These compare to the 10-year average median multiples of 3.08x tangible book value and 15.9x earnings. Analysts expect 2011 and 2012 BKX earnings to exceed 2010 operating earnings by +32.9% and 70.9%, respectively.
Wednesday’s equity markets. On lower volume, equity markets finished sharply lower, and the market trend returned to correction, after the briefest of market uptrends. The Nasdaq, NYSE, SPX and DJI were all lower, off -2.33%, -2.31%, -2.28% and -2.22%, respectively. The day’s tone turned sharply pessimistic after disappointing May mortgage applications and ADP employment. The pessimism worsened after release of April ISM. Equities extended their slide through the day, with a few upticks, but ended on the lows. Trading desks described the sell-off as orderly. While there was obviously institutional participation, volume was notably lower, surprising given the significant decline in indexes. World economic news also showed a growth slowdown. Tuesday, China’s PMI showed the slowest pace of expansion in nine months, while the Eurozone equivalent fell to a seven month low. The United Kingdom’s gauge of factory growth was its weakest in two years, and Russia’s index signaled “near stagnation”. All these data points contributed to Wednesday’s sell-off, the SPX’s steepest since August 2010. Economic data points over the last several trading sessions have consistently indicated a growth slowdown.
Trading desks reported a relatively quiet day with customers selling economically sensitive sectors and reluctant buyers. More than one trading desk also reported a noticeable lack of short sellers in this down tape. The VIX finished the day at 18.30, up +18.45%.
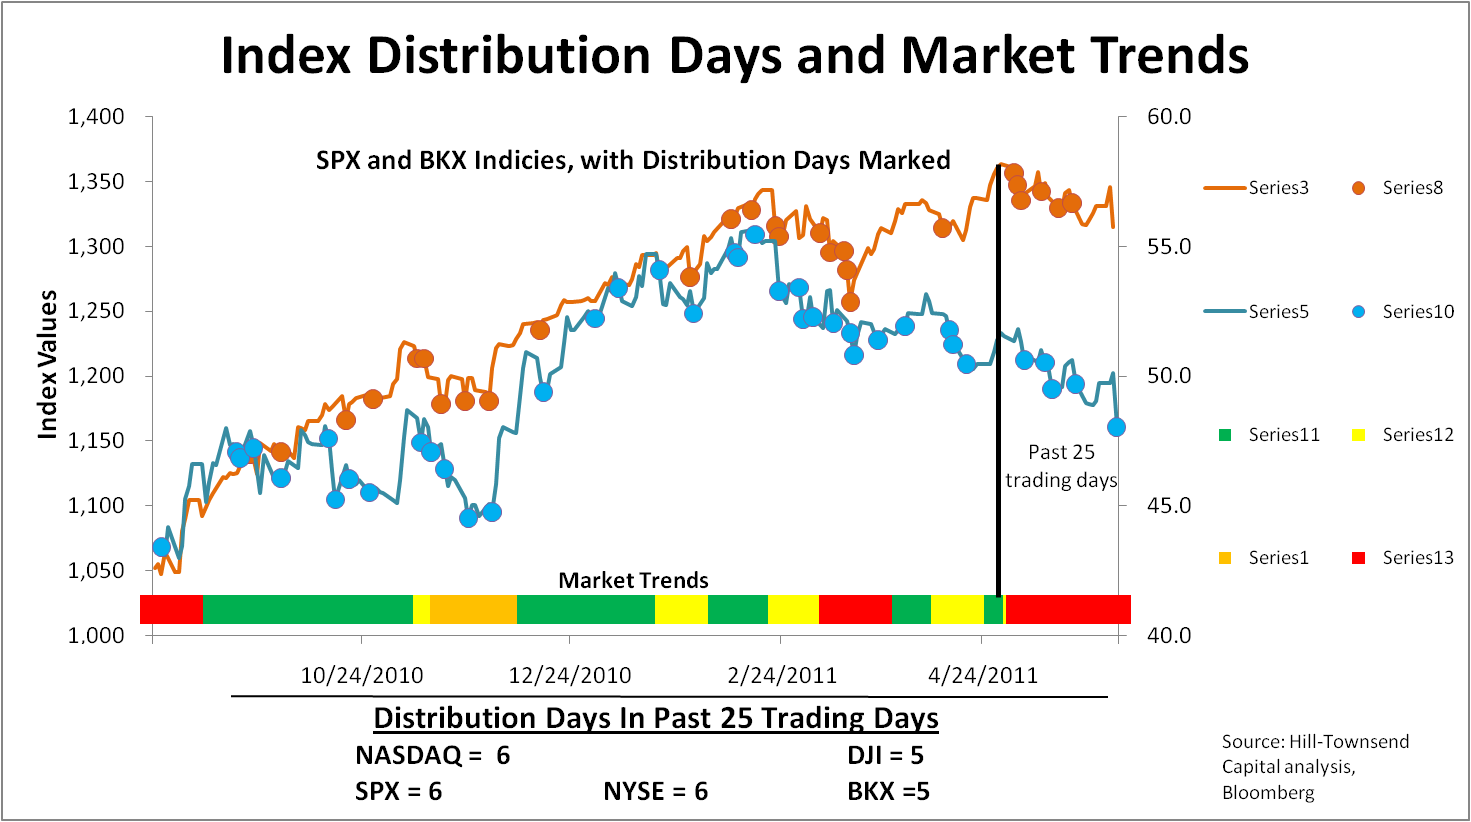
Technical indicators turned negative. The SPX and DJI experienced their largest percentage drops since last August. Both the SPX and DJI are at levels not seen since April 19th. The SPX, Nasdaq, NYSE, and DJI all broke through multiple support levels. Next support levels for the SPX are 1303 and then 1293. Resistance for the SPX is 1335 and then 1355. The SPX and NYSE closed below their 50- and 100-day moving averages, but above their 200-day average. The DJI and Nasdaq closed below their 50-day moving average, but held the 100- and 200-day averages. The SPX has not been below its 100-day moving average since March 16th. The relative strength indicator fell to 43.57 from Tuesday’s reading of 55.29 and is in the lower neutral range.
All market segments were negative. Leading segments include utilities, healthcare and consumer goods, while the laggards were basic materials, industrials, and financials.
Financials sold off sharply. The BKX, KRX, and XLF were off -4.11%, -3.56%, and -3.38%, respectively. The BKX sold off sharply from the bell and extended its losses into the afternoon, finishing on its lows for the day. All 24 names in the BKX were off at least -2.2%, with RF, STI and BBT off the most, down -7.37%, -6.43%, and -5.77%, respectively. The BKX has not experienced a percentage sell off this sharp since August 11, 2010, and is now trading at levels it has not seen since December 7th. Among broader financials, TROW, JNS and ETFC were down the most, off at least -5.19%. While there were not company-specific reasons for the selloff, the economic data from the last few weeks has signaled a deceleration in economic growth, which suggests reduced lending prospects and weaker mortgage markets. Over the last few trading sessions we have seen pending home sales fall by double digits, S&P Case Shiller Home Index fall more than expected, and employment indications stagnate. The BKX, KRX and XLF all finished below their 50-, 100-, and 200-day moving averages. While the broader indices have recovered their post-September 2008 losses, bank stocks have not, with the BKX closing -17.1% below its April 2010 high and -41.8% below its best level of 82.55 in September 2008.
NYSE Indicators. Volume fell -21.5% to 1.190 billion shares, 1.29x the 50-day moving average, from 1.515 billion shares Tuesday. Market breadth was negative, and up volume lagged down volume, both by significant margins. Advancing stocks lagged decliners by 91943 (compared to +1577 Tuesday), or 0.22:1. Up volume lagged down volume by 0.05:1.
SPX. On lower volume, the SPX fell -30.65 points, or -2.28%, to 1314.55. Volume fell -7.44% to 884.88 million shares, down from 956.01 million shares Tuesday but above the 725.75 million share 50-day moving average. For the 154th consecutive day, the SPX’s 50-day moving average closed above its 200-day moving average (1330.95 vs. 1245.91, respectively). The SPX closed above its 200-week moving average (1166.65).
The SPX opened at the prior day’s close and immediately set the intra-day high of 3145.20. Within minute, the index dropped to the 1340 level. The SPX staged a stair-step sell-off, falling 5 points quickly and then trading sideways for approximately 45 minutes, with the cycle repeating four times. At 10:00, 11:00, and 12:15, the index hit 1335, 1330, and 1325, respectively. By 2:30, the index fell to the 1320 level and by 3:45, the index traded to 1315. The intra-day low came minutes before the close at 1313.71, and the SPX finished just above that level.
Technical indicators turned from positive to mixed following yesterday’s losses. The index returned to correction. The index’s May 2nd failure at the 1370 level and brief breakdown through the 50-day moving average last week found support at the 100-day moving average (1315.43). Tuesday’s retake of the 50-day moving average was brief, as yesterday’s losses pushed the SPX back below the 50-day average but also below the 100-day moving average. The index fell below the 100-day moving average for the first time since March 16th and only the second time since September 8, 2010. The index’s recent correction has stalled the 50-day average’s positive momentum. After narrowing, the gap between the 50- and 100-day moving averages is, so far, holding steady. The index closed above 1300 for the 48th straight session. The index closed above its April 2010 highs for the 124th straight session. The SPX closed (by -1.54%) below its 20-day moving average (1335.06) for the first time in three sessions. The index closed (by -1.23%) below its 50-day moving average for first time in four sessions. The index closed (by -0.20%) below its 100-day moving average for the first time in 53 sessions. The SPX closed +5.51% above its 200-day moving average. The 20-day moving average fell for the eighth straight session. The directional momentum indicator switched back to negative after turning positive the day before, and the trend is weak and stable. Relative strength fell to 42.63 from 55.82, a neutral range. Next resistance is at 1335.26; next support is at 1303.77.
BKX. On higher volume, the KBW bank index fell -2.06 points, or -4.11%, to 48.04. Volume rose +22.21% to 94.80 million shares, up from 77.57 million shares Tuesday and below the 95.30 million share 50-day average. Recent low financial index volumes versus historical averages relates to Citigroup’s May 6th 10-1 reverse split. The BKX closed +11.77% above its August 30 closing low of 42.98, the trough of the recent prior correction, but -17.10% and -13.64% below its April 23, 2010, and February 14, 2011 closing highs, respectively.
Financials were the market’s worst performing sector, and large-cap banks underperformed regionals. The BKX gapped lower at the open, immediately setting the intra-day high of 50.28. Through 10:00, the index fell over -2.0%, crossing the 49.00 level at 10:05. By 12:15, the index reached the 48.50 level, a -3.0% intra-day decline. Financials traded lower through the afternoon, albeit less severely, and at 3:30, had reached 48.25. A sharper sell-off into the closing bell set the intra-day low at 3:51 at 48.00. The index finished just above the 48.00 threshold.
Technical indicators are mostly negative. The market’s correction has withdrawn support for financial stocks. The index has remained bound on the upside by the 50-day moving average (now at 50.94 and falling), broke down through 100-day support on April 13th, and after briefly retaking the 200-day moving average on Tuesday, fell back below that level decisively yesterday. The 20-day moving average (49.96) has remained below the 50-day moving average since March 11th and crossed below the 100-day moving (now at 52.17) average on April 15th. The 50-day moving average crossed below the 100-day moving average on April 21st. The index closed below the 20-, 50-, 100-, and 200-day moving averages for the 15th, 38th, 34th, and first consecutive sessions, respectively. The index closed below 50 for the sixth time in seven sessions. The 20-, 50-, and 100-day moving averages fell. The 20-day closed (by -0.99 points) below the 50-day for the 55th straight day, and the gap expanded. The 50-day moving average closed (by +1.13 points) above the 200-day moving average for the 96th straight session, but gap narrowed. The 100-day moving average closed (by +2.36 points) above the 200-day moving average for the 78th straight session, but gap narrowed. The directional movement indicator is negative for the 18th straight session, and the trend is strong and stable. Relative strength fell to 33.66 from 48.25, the low end of a neutral range. Next resistance is 49.42; next support at 47.33.