This morning. U.S. equity markets are in correction. Asian equity markets closed lower, while European markets are trading modestly higher. U.S. equity futures are moderately higher. Economic news focuses on the latest week’s initial and continuing jobs report. Overseas news focuses on Eurozone monetary policy, where the ECB left interest rates unchanged. U.S. Treasury yields are mixed, with auctions of 30-year bonds today. The U.S. dollar is mixed. Commodities markets are mostly higher, with weaker petroleum, mixed metals, and higher agriculture. After a fair value adjustment of +1.86 points, June SPX equity futures are at 1281.10, up +2.24 points. The SPX opens at 1279.56, -6.16% below its recent April 29 multi-year closing high and -3.77% below its 50-day moving average. The SPX is -1.96% below April’s lowest closing low of 1305.14. Next resistance is at 1285.26. Next support is at 1275.64.
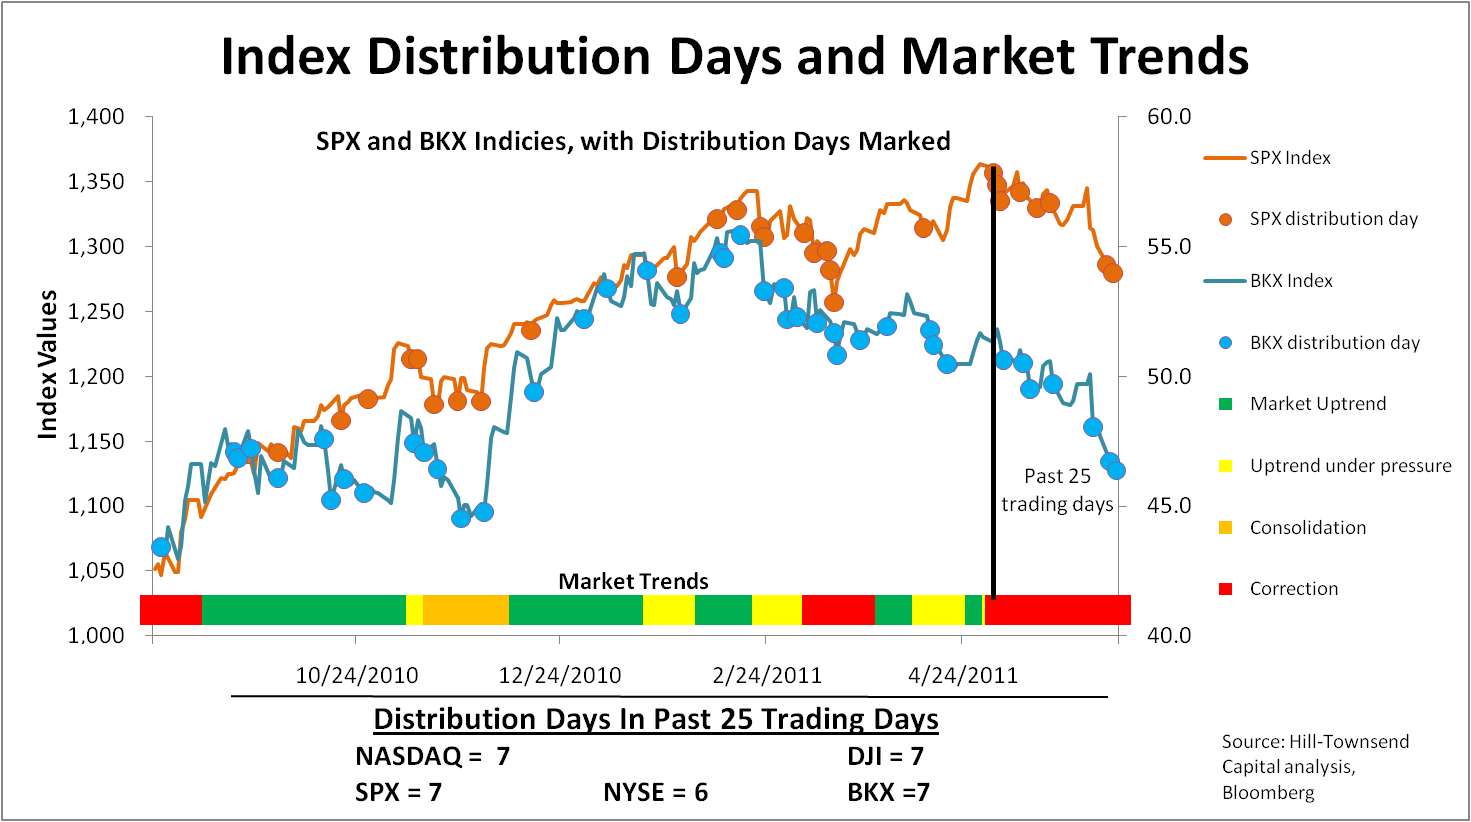
Wednesday, U.S. equity markets traded around the flat line through most of the day, but turned lower mid-afternoon to end with moderate losses. Volume was higher. The late fade coincided with the Senate rejection of a bill to delay implementation of a proposed Fed rule on debit card swipe fees. OPEC’s no-decision announcement also contributed to weakness outside commodities stocks. The fade came despite a better than expected Fed Beige book, which reported generally better economic conditions and growth in most districts. The DJI was the day’s best performer, down -0.18%, while the SPX, NYSE composite, and Nasdaq declined -0.42%, -0.62%, and -0.97% respectively. Market segments were mixed. Oil and gas, , telecommunications, and health care were the day’s best performers. Technology, financials, and basic materials were the worst. Volatility rose late in the session. The VIX ended at 18.79, up +3.98% from 18.07 the prior day. The Nasdaq, NYSE, and SPX recorded distribution days, but there was no change in the distribution day count. The count numbers 7 on the Nasdaq, DJI, and SPX, and 6 on the NYSE. Distribution days signal institutional selling in the past 25 trading days. Trading desks reported a quiet afternoon trade, better to the sell-side, with long sellers on the rallies and few short-sellers.
Asian and European equity markets are also in correction. Asian markets closed mixed, but lower in China on reports of weakness in residential real estate prices. The Nikkei closed up +0.19% on a +22.2% increase in volume. Financials were the 8th worst performing segment, down -0.40%. Health care, consumer services, and utilities were the best performers. Chinese equity markets closed lower, with the Hang Seng and Shanghai composite down -0.23% and -1.71%, respectively. On the SHCOMP, volume rose +12.7%. All market segments closed lower. Oil and gas, financials, and basic materials were the best performers. Financials fell -1.43%. Health care, utilities, and consumer goods. The SHCOMP closed at 2703.35, -11.6% below its recent April 18th 3057.33 high, -3.73% below its 2010 close, and -4.98% below the 2845.17 200-day moving average. However, the SHCOMP closed +1.57% above its 2011 low of 2661.45, set on January 25th. In Europe, equity markets are modestly higher, with better strength in basic materials, industrials, and utilities. Consumer goods, telecommunications, and financials are the worst performers. The EuroStoxx 50, FTSE, and DAX are higher +0.05%, +0.07%, and +0.28%, respectively. On the EuroStoxx, financials are the 10th worst performing segment, down -0.44%.
Despite sovereign debt and other macro-concerns, LIBOR levels are at their lowest levels since early 2009, well below those seen prior to last year’s sovereign debt crisis. Overnight USD LIBOR rose to 0.12700%, up from 0.12650% the prior day and 0.25188% at year-end. USD 3-month LIBOR is lower at 0.24950%, compared to 0.25025% the prior day and 0.30950% at year-end. The U.S. dollar is stronger against the euro and pound, slightly weaker compared to the yen. The dollar, which has trended lower since last June, trades below its 50-, 100-, and 200-day moving averages. The euro trades at US$1.4619, compared to US$1.4583 Wednesday and US$1.4691 the prior day. After a sharp decline in early May, the Euro has risen back above its US$1.4420 50-day moving average. The dollar trades at ¥80.02, compared to ¥79.89 Wednesday and ¥80.09 the prior day. The yen trades better than its 50-day moving average ¥81.88. U.S. Treasury yields are mixed, with 2- and 10-year maturities yielding 0.397% and 2.933%, respectively, compared to 0.381% and 2.939% Wednesday. The yield curve narrowed to +2.536% from +2.558% the prior day. In the past year, the 2- and 10-year spread has varied from a low of +1.959% on August 26, 2010, and a high of +2.889% on February 3, 2011. Commodities prices are mostly higher, with higher energy, higher precious metals, lower aluminum and copper, and higher agriculture.
Options Markets. The equity P/C ratio remains elevated, closing the day at 0.73, compared to the prior day’s 0.79 and 10-day average 0.65. Based on market patterns since March 2009, a ratio above 0.75 is extremely bearish. Yesterday, the total P/C ratio followed a similar pattern, closing at 1.09, below Friday’s extreme 1.23 reading, but above its 10-day 0.95 average. Since the March 2009 bottom, short-term extreme readings in the total P/C ratio have led to higher equity prices within four trading days. A failure in this pattern over the next two trading days may signal continued correction in equity prices.
U.S. news and economic reporting. Today’s economic reporting focuses on the latest week’s initial and continuing jobless claims, with surveys at 419K and 3700K, respectively. Other reports include the April trade balance,, the Bloomberg consumer comfort, and wholesale inventories.
Overseas news. Today, the European Central Bank and the Bank of England left their respective benchmark interest rates unchanged. The ECB signaled a 0.25% rate increase next month with “strong vigilance” reintroduced into its policy statement. In the first quarter, Japan’s GDP was revised up to a -3.5% annual contraction rate from the initial -3.7% annual rate. Today, employees at Greek government-owned companies slated for privatization began a 24-hour strike.
Company news/research:
· AIG – initiated at buy at Deutsche Bank, price target of $34
1Q2011 Earnings. The first quarter’s earnings results have exceeded EPS and revenue expectations. Of the 470 S&P500 companies that reported earnings to date, 72% (339 of the 470) beat operating EPS estimates, versus the historical average of 62%. In aggregate, companies have beat by an average of +7.0% (versus a historical average of +2%). EPS is up +19.7% over the prior year. Though challenged in the current operating environment, 355 companies (75%) reported increased revenues and 317 companies (67%) beat revenue estimates. In the first quarter of 2011, analysts estimate the SPX will earn $24.32 per share, compared to $22.47 and $19.49 per share in 4Q10 and 1Q10, a +8.2% and +24.8% increase, respectively.
With all 24 BKX members reporting, 75% (18 out of 24) beat operating EPS estimates. Bank revenues disappointed slightly (by -0.78% on average), with 58% of BKX members missing estimates. Eleven banks (46%) reported increased revenues over the prior year’s quarter. In the first quarter of 2011, the BKX earned $0.95 per share, a +4.4% increase over 4Q10 EPS of $0.91 and 180% above 1Q10 EPS of $0.34.
Valuation. The SPX trades at 12.9x estimated 2011 earnings ($99.37) and 11.4x estimated 2012 earnings ($112.52), compared to 12.9x and 11.4x respective 2011-12 earnings yesterday. The 10-year average median Price/Earnings multiple is 20.0x. Since the beginning of 2011, analysts increased 2011 and 2012 earnings estimates by +5.0%, and +4.9%, respectively. Analysts expect 2011 and 2012 earnings to exceed 2010 earnings ($84.78) by +17.2% and +32.7%, respectively.
Large-cap banks trade at a median 1.38x tangible book value and 12.0x 2011 consensus earnings, compared to 1.41x tangible book value and 12.1x 2011 earnings yesterday. These compare to the 10-year average median multiples of 3.08x tangible book value and 15.9x earnings. Analysts expect 2011 and 2012 BKX earnings to exceed 2010 operating earnings by +32.9% and 70.9%, respectively.
Wednesday’s equity markets. On mixed volume, the equity markets closed lower. The Nasdaq, NYSE, SPX and DJI were lower, off -0.97%, -0.62%, -0.42%, and -0.18%, respectively. The sell-off extended to a 6th straight day, the SPX’ longest losing streak since February 2009. Markets began the day modestly lower and spent the morning varying from positive to negative in a relatively tight range. Markets were slightly higher after noon, but began to sell off after 1:00 in anticipation of the Fed’s Beige Book and the 2:00 Senate vote on bank debit interchange fees. At 2:00, the Fed released its Beige Book, which indicated that the economy expanded at a “steady pace” in most of the U.S., while slowing in 4 of the 12 regions. The sell off continued after the Senate vote, but reversed course just after 2:30 and returned briefly to positive territory, before selling off into the close. Trading desks report more of the same, de-risking on up ticks as investors look to reduce equity exposure. Short sellers continue to be relatively absent. Buyers remain on the sidelines, with long position holders adding small amounts on dips. The VIX finished the day at 18.79, up +3.98%.
Technical indicators are negative. The SPX traded through support at 1281 and tested 1277, before bouncing in the afternoon. The DJI, Nasdaq , and NYSE each broke through primary support, but held above secondary support. Volume was slightly higher on all exchanges, but the DJI. The latest AAII Investor Bullish Sentiment was the lowest since August 20010, at 24.42 versus last week’s 30.18. The Investment Company Institute (ICI) showed a fifth week of outflows with -$1.091mm exiting domestic equity funds. The SPX, DJI, NYSE, and Nasdaq finished below their 50- and 100-day moving averages, but above their 200-day averages. The Bloomberg NYSE new net highs was lower at -75 versus Tuesday’s -41. The relative strength indicator fell to 34.75 from Monday’s reading of 36.96, indicating an oversold condition.
Market segments were mixed. Oil and gas, telecommunications, and utilities were the leaders, while technology, financials, and basic materials were the laggards.
Financials were lower. The XLF, KRX, and BKX were lower, off -0.91%, -0.66%, and -0.58%, respectively. Among broader financials, V (-3.9%), XL, (-2.76%) and TROW (-2.34%) were the laggards. HBAN (+1.29%), ZION (+1.01%), and RF (+0.99%) were the leaders. The BKX began the day higher, rallied through midday, but the rally failed when the Senate refused to delay proposed debit interchange rules. The BKX began to sell off as the vote began at 2:00, tried to rally just before 3:00, but failed again and closed near the lows for the day. The BKX ended with 5 names higher, 18 lower and 1 unchanged. The KRX ended with 9 names higher, 38 lower and 3 unchanged. Leaders included FNB, WABC, and BXS. Laggards were TCB, FMBI, and SNV. The BKX, KRX, and XLF all finished below their 50-, 100-, and 200-day moving averages. While the broader indices have recovered their post-September 2008 losses, bank stocks have not, with the BKX closing -19.98% below its April 2010 high and -43.82% below its best level of 82.55 in September 2008.
NYSE Indicators. Volume rose +8.38% to 1.013 billion shares, from 934.66 million shares Tuesday, 1.08x the 933.86 million share 50-day moving average. Market breadth was negative, and up volume trailed down volume. Advancing stocks lagged decliners by -1437 (compared to +386 Tuesday), or 0.36:1. Up volume led down volume by 0.32:1.
SPX. On higher volume, the SPX fell -5.38 points, or -0.42%, to 1279.56. Volume rose +1.44% to 761.57 million shares, up from 750.78 million shares Tuesday and above the 735.60 million share 50-day moving average. For the 158th consecutive day, the SPX’s 50-day moving average closed above its 200-day moving average (1329.73 vs. 1251.22, respectively). The SPX closed above its 200-week moving average (1165.70).
The SPX opened at 1284, slightly under the prior day’s close. By 9:45, the index made a rally to the 1286 level, in positive territory for the day, but the rally was quickly sold. By 10:00, the index fell to the 1280 level. Finding support there, the SPX quickly reversed. By 10:50, the index turned positive and at 11:07, the index set its intra-day high of 1287.04. The rally was sold back to 1282. At 11:55 and 12:50, the index made two more rally attempts into positive territory, but both were sold. Following the second rally and sell-off, the index fell through the 1280 level to 1278 at 1:55. A sharp lift at 2:30 brought the index back to 1284 within minutes. A 3:15 sell-off sent the index to its intra-day low of 1277.42 at 3:34. The SPX made a final attempt to break above 1280 in trading’s final 30 minutes, but that brief rally was sold and the index finished below that level and near the intra-day low.
Technical indicators are negative. The index’s May 2nd failure at the 1370 level moved stocks into correction. The SPX broke below the 50-, 100-, and 150-day moving averages. The 50-day average has remained above the 100-day moving average by a small, but consistent margin. The index closed below 1300 for the third straight session. The index closed above its April 2010 highs for the 129th straight session. The SPX closed (by -3.21%) below its 20-day moving average (1321.95) for the sixth straight session. The index closed (by -3.77%) below its 50-day moving average for sixth straight session. The index closed (by -2.91%) below its 100-day moving average (1317.92) for the sixth straight session. The SPX closed +2.26% above its 200-day moving average. The 20-, 50-, and 100-day moving averages fell for the 12th, third, and second straight sessions, respectively. The last time the 100-day moving average switched from rising to falling was June 23, 2010, six trading days before the 1010.91 bottom on July 1st. The directional momentum indicator is negative for the sixth straight day, and the trend is moderate and increasing. Relative strength fell to 31.92 from 33.77, its lowest reading since July 2nd, 2010 and nearing oversold territory. Next resistance is at 1285.26; next support is at 1275.64.
BKX. On higher volume, the KBW bank index fell -0.27 points, or -0.58%, to 46.37. Volume rose +3.86% to 88.44 million shares, up from 85.15 million shares Tuesday and below the 94.29 million share 50-day average. The BKX closed +7.89% above its August 30 closing low of 42.98, the trough of the recent prior correction, but -19.98% and -16.65% below its April 23, 2010, and February 14, 2011 closing highs, respectively.
Financials underperformed the market, and regionals underperformed large-cap banks. The BKX opened at 46.52, below the prior day’s close. Within minutes, the index moved into positive territory and by 9:45, the BKX reached 46.90. The quick rally was sold nearly back to break-even, but momentum remained positive. The index rallied through the morning, and at 12:10, the BKX set its intra-day high of 46.99. Through 2:00, the index retraced gains back to break-even. The Senate’s 2:00 vote rejecting a delay of the pending debit card fee price-fixing regulations sent the index into negative territory. By 2:30, the index reach 46.40. A quick relief rally to the 46.55 level was sold, and at 3:35, the index reached its intra-day low of 46.26. Financials attempted a weak rally into the close to finish modestly above the low.
Technical indicators are negative. The market’s correction has withdrawn support for financial stocks. The index fell through all major moving averages, crossing decisively below the 200-day moving average on June 1st. The 20-day moving average (49.02 and falling) is below the 50- and 100-day moving averages (50.49 and 51.84, respectively) and the 50-day average is below the 100-day average. The index closed below the 20-, 50-, 100-, and 200-day moving averages for the 20th, 43rd, 39th, and sixth consecutive sessions, respectively. The index closed below 50 for the 11th time in 12 sessions. The 20-, 50-, and 100-day moving averages fell. The 20-day closed (by -1.47 points) below the 50-day for the 60th straight day, and the gap expanded. The 50-day moving average closed (by +0.61 points) above the 200-day moving average for the 101st straight session, but the gap narrowed and indicates a cross next week. The 100-day moving average closed (by +1.95 points) above the 200-day moving average for the 83rd straight session, but the gap narrowed. The directional movement indicator is negative for the 23rd straight session, and the trend is strong and increasing. Relative strength fell to 26.12 from 27.30, the lowest since January 20, 2009 and an oversold range. Next resistance is 46.82; next support at 46.09.