I've not had anything interesting to put in this header for a while and now I have two items of interest.
The first is a comment that an Axionista requested be posted anonymously that detailed that person's difficulty in buying shares. Rather than repeat it here, follow
this link to the comment describing the difficulty of acquiring 300K shares of (AXPW). In summary, a late day buy order above market was only a little over half filled the first day and took close to an hour to complete filling the next morning.This comment was particularly interesting to me because I had been posting for some number of days prior that the sellers were "too easy", constantly displaying a lack of discipline, which if corrected would result in better prices to the sellers. This was my judgment based on my close observation of intra-day bid, ask and trade behavior for more than 16 months now.
Whether it was coincidence, the anonymous comment, my cajoling about lack of discipline, or a combination of those, there was an immediate appearance of change in bid, ask and price behavior on 5/31. See the 5/31 daily commentary contained in the "Beginning 5/1 ..." instablog linked down in the "boilerplate" below.
The other thing of note is the change in daily short sales. My feeling is that we can't see any real sustained price appreciation without "normal" market-making activity and the volume (liquidity) that should accompany it. When we have those, we have the possibility of sustained trends, both up and down, giving us the "waves" necessary for traders and investors to have confidence in the risk/reward profiles, permitting them to enter the market with the hope of doing well.
For some time we did not have "normal" market-making, as detailed when John Petersen posted back in January about a big drop in the daily short sales starting back in November of '12. Interestingly, this was about the same time we all thought the "big uglies" were exhausted and I also posted that I thought we might be starting a move up. Go figure!
I mention the following as a possible counter-point to my thoughts that without "normal" market-maker activity we can't get much price appreciation. OTOH, what we got may certainly not qualify as "appreciable", being we only got to $0.3710 VWAP (1/14/13) from $0.2352 VWAP on 11/2. A nice percentage rise, certainly, but not a "big" move in absolute terms.
In my 11/27 post in AXPW: Intra-Day Trade & Buy:Sell Inflection Point Charting 11/14/2012 I said "Looking at my experimental inflection point calculations gives me a warm fuzzy feeling. The trend suggested beginning around the 12th is apparently coming to fruition and gaining strength. Let's hope it's not just another few-days "blip" up followed by a retreat. I think not because the move has been long and strong enough to move all, including the newly added 200-day calculation, into an upward attitude". In the 11/13 entry in AXPW: Intra-Day Trade & Buy:Sell Inflection Point Charting's I said "If my original inflection point calculations, and my interpretation of them, are valid we have a move up beginning. All the "correct" conditions exist: ...".
These examples may demonstrate that "normal" market-maker participation is not needed. Regardless, another change has appeared ...
Beginning 4/22/2013, with the appearance in our market of some active market-makers we'd not seen for quite a long time, the daily short sales began making a trend up towards the previously-seen levels, as I suggested would eventually happen. As of this writing (6/22013), the 10, 25, 50 and 100-day average daily short percentages are 34.31%, 25.43%, 16.66% and 12.97%, respectively, and all are rising. Now this is not for ego-gratification, but rather because I'm always more comfortable when things behave as expected because it suggests that I have, indeed, managed to learn something during this long trek from complete ignorance. It will, combined with other things, give me the confidence to stick my neck out more frequently and, as well, get decapitated more frequently! :-((
Regardless of the validity of daily short sales supporting John's thesis that the "big uglies" are out, his thesis is, IMO, valid and supported by AXPW Fails-to-deliver Charts 2/11/2013, with data through the 4/30/2013 period. The updated data is made available about every two weeks and I update my instablog's charts shortly after each update becomes available.
What follows is my normal boilerplate and the long-time readers can skip on down to the charts.
I've been manually collecting this data for a year now while volume was low and it was therefore reasonable to do so. I'll stop when it gets too arduous unless I can craft a mechanized capture of most of the stuff.
I've captured enough data now that I can reasonably expect to be able to detect patterns on the charts that may signal, somewhat reliably, when price moves are about to occur. To help more easily identify any useful patterns, I've made an instablog,
Axion Power International (AXPW) 2/13/2012 And Forward One Year Experimental Charts Snapshots. I've also added some lines to them that may assist in this. For anybody with an interest, I welcome any suggestions and/or help.I'll update this instablog daily as long as I can for anybody that might find it useful. The charts will stay near the top and the text updates detailing daily data and expressing my most recent thoughts will follow after the charts.
I've arranged the chart segments in this instablog to put what I think are related stuff close together.
This is the tenth installment of the original "AXPW: Some Intra-Day Trade Charting" instablogs I've started doing on Seeking Alpha. The others grew, as I added daily commentary and FINRA data, to the point I was afraid the load time might become an irritant for folks that have less internet bandwidth or older computing equipment so I've started rolling to a new one aperiodically.
Versions subsequent to the original (latest to oldest) can be found here.
AXPW: Intra-Day Trade & Buy:Sell Inflection Point Charting Beginning 5/1/2013
AXPW: Intra-Day Trade & Buy:Sell Inflection Point Charting 3/1/2013
AXPW: Intra-Day Trade & Buy:Sell Inflection Point Charting 02/01/2013
AXPW: Intra-Day Trade & Buy:Sell Inflection Point Charting 12/15/2012
AXPW: Intra-Day Trade & Buy:Sell Inflection Point Charting 11/14/2012
AXPW: Intra-Day Trade & Buy:Sell Inflection Point Charting
AXPW: Intra-Day Trade Charting 9/6/2012 - Xx/xx/2012
AXPW: Intra-Day Trade Charting 7/7/2012 - 9/5/2012
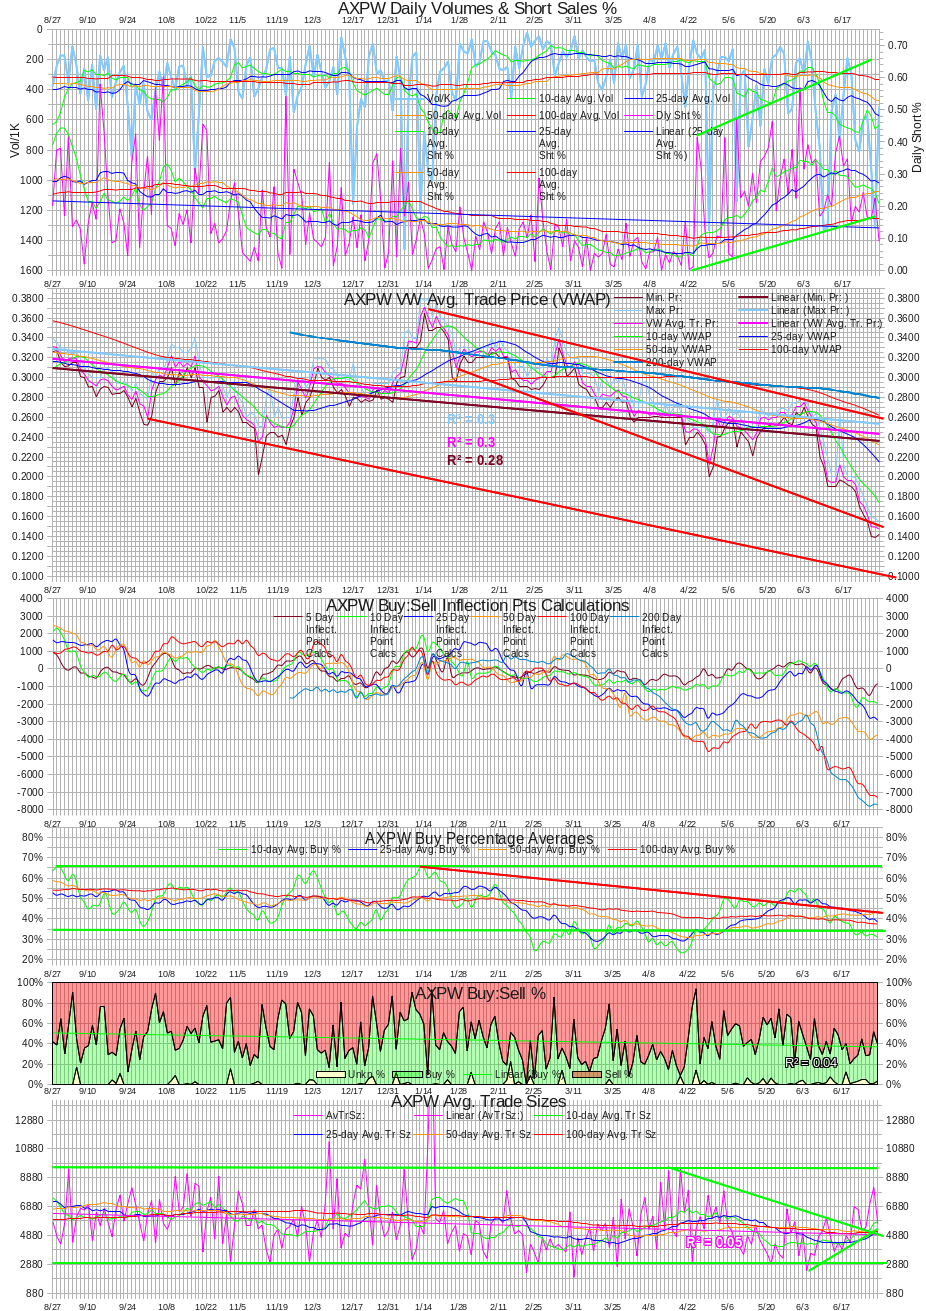
In the below chart note that the volume is inverted to enhance readability! Be aware when you view it!
(right-click and open in new tab, position cursor over image to be able to zoom and scroll)
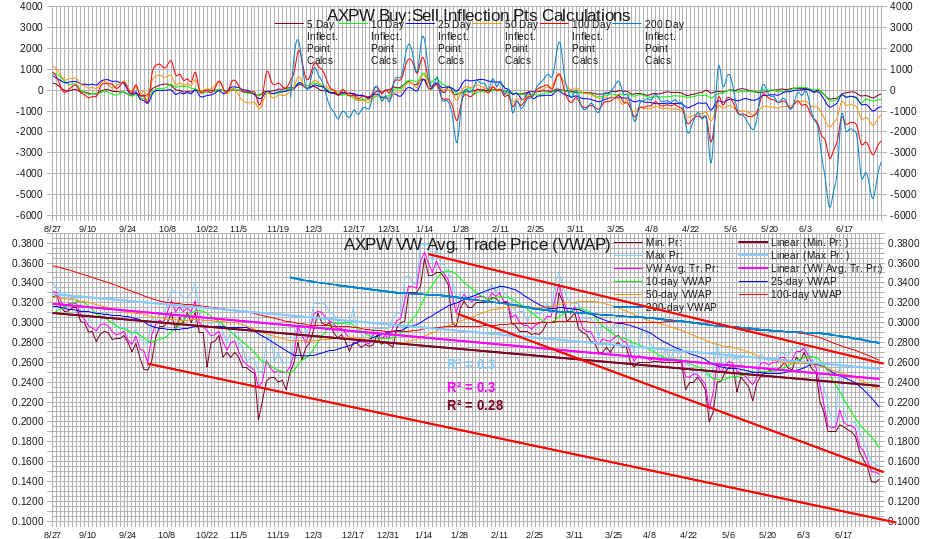
The following are modified inflection point calculations bracketing a price chart for comparison. Note that the false bullish moves and contrary moves of the 5-day has been eliminated.
The two inflection points are calculated differently from each other and differently from the original above. More work to do, this is a start, hopefully.
I've identified some changes I want to try on the new inflection point calculations but haven't had time to implement them yet. I'll work them in over time after a little experimentation.
Comments and further suggestions welcome.
(right-click and open in new tab, position cursor over image to be able to zoom and scroll)
Continuing tracking the "Dly Sht % of 'sells'" and inflection point calculations values are now only in the latest daily comment - attempting to keep things shorter for faster loading.
06/28/2013: EOD stuff partially copied to the concentrator.
# Trds: 90, MinTrSz: 400, MaxTrSz: 59000, Vol 512780, AvTrSz: 5698
Min. Pr: 0.1421, Max Pr: 0.1550, VW Avg. Tr. Pr:0.1474
# Buys, Shares: 35 187728, VW Avg Buy Pr: 0.1483
# Sells, Shares: 51 308352, VW Avg Sell Pr: 0.1469
# Unkn, Shares: 4 16700, VW Avg Unk. Pr: 0.1473
Buy:Sell 1:1.64 (36.6% "buys"), DlyShts 46477 (9.06%), Dly Sht % of 'sells' 15.07%
06/28: 85% x avg. of 20 lowest intra-day VWAPs, $0.1956, in 40 days: $0.1663
Prior recent calculations of estimated next share issue price:
06/14: 85% x avg. of 20 lowest intra-day VWAPs, $0.2315, in 40 days: $0.1968
06/17: 85% x avg. of 20 lowest intra-day VWAPs, $0.2292, in 40 days: $0.1948
06/18: 85% x avg. of 20 lowest intra-day VWAPs, $0.2266, in 40 days: $0.1926
06/19: 85% x avg. of 20 lowest intra-day VWAPs, $0.2242, in 40 days: $0.1906
06/20: 85% x avg. of 20 lowest intra-day VWAPs, $0.2214, in 40 days: $0.1882
06/21: 85% x avg. of 20 lowest intra-day VWAPs, $0.2176, in 40 days: $0.1850
06/24: 85% x avg. of 20 lowest intra-day VWAPs, $0.2147, in 40 days: $0.1825
06/25: 85% x avg. of 20 lowest intra-day VWAPs, $0.2103, in 40 days: $0.1788
06/26: 85% x avg. of 20 lowest intra-day VWAPs, $0.2053, in 40 days: $0.1745
06/27: 85% x avg. of 20 lowest intra-day VWAPs, $0.2005, in 40 days: $0.1704
WVAP's continue the trend: $0.2122, $0.1999, $0.1963, $0.1961, $0.1925, $0.1751, $0.1710, $0.1619, $0.1497, $0.1495 & today's $0.1474.
Volumes, in thousands: 742.26, 436.05, 189.36, 295.91, 735.03, 808.78, 598.25, 913.97, 1,313.86 and 512.78.
Well, back on trend today, except that the daily short sales were low. For the moment I'm thinking this aberration is a result of market-makers having taken advantage of a predictably declining price to do covering buys of their normal daily shorts and releasing the incoming shares backing prior sell orders into the market to make more money. Since I saw ATDF or NITE at the top of the ask heap eighteen times out of my twenty-five checks, and we know that when they dominated the selling we had very low daily short sales, this seems reasonable. Moreover, we can presume that some of their sales bypassed the other offers and just hit the bid. This may account for the very low "Dly Sht % of 'sells'" above too. Of the times I checked when ATDF or NITE weren't at the top they were very frequently co-located in second place, so I presume the urge to sell was strong in folks trading through those MMs.
ARCA traders were a bit less aggressive today - only four times did I see them come in with a reduced offer. Most of the day the best ARCA offer sat at $0.15, and for a while at $0.159. I hope this is not just a "Friday Effect" with them returning to form next week.
My original experimental inflection point calculations are still quite negative, although the one-day change for the five and fifty-day periods show some improvement. The five-day change has all six periods improving, along with the average rate of change over five days for all periods. This is still generally just a reduction in the rate of weakening.
My never version continues the minor improvement for all six periods for the one-day change. The five-day change is similar but for the 10-day, which is showing marked improvement. The average rate of change over five days has a healthy improvement for all six periods. This is the second day of nice improvement, but still is characterized as reduction in weakness, rather than strengthening, in my judgment.
Details of "Dly Sht % of 'sells'" and inflection points omitted from the concentrator.
Rolling 5-day inflection point calculation aggregate percentage change (now abbreviated):
******* ******* *5 Day** *10 Day * * 25Day ** 50 Day **100Day* 200 Day
05/30 5 Day +0185.05 +0707.28 +0736.83 +0874.32 -0282.25 +0420.90
05/31 5 Day +0037.79 +0815.38 +0569.09 +0833.03 -0629.11 +0391.59
06/03 5 Day +0168.26 +0701.30 +0268.47 +0722.68 -0669.75 +0550.03
06/04 5 Day -0216.81 +0219.14 +0404.89 +0226.40 -0649.62 +0655.92
06/05 5 Day +0605.94 -0175.97 +0081.01 +0042.50 -1068.63 -0017.76
06/06 5 Day -0211.85 -0026.80 +0558.98 +0153.33 -1105.31 -0108.64
06/07 5 Day -0238.20 -0200.40 +0496.68 +0175.57 -0917.68 -0920.64
06/10 5 Day +1000.15 +0831.89 -0340.58 -0516.06 -0766.54 -1876.47
06/11 5 Day +0968.71 +1185.52 +0925.02 -0340.03 -1688.83 -2473.15
06/12 5 Day -0841.12 +1447.06 -0992.98 -0525.75 -1661.85 -2736.57
06/13 5 Day +1251.46 +1463.30 +1397.93 -0638.96 -1236.80 -2763.16
06/14 5 Day -0833.24 +1270.91 +1358.89 -0332.82 -0936.07 -2102.02
06/17 5 Day +0125.70 -0874.45 -0789.80 +0288.51 -1241.64 -1534.94
06/18 5 Day +0487.48 -0481.24 -0448.72 +0260.20 -0110.58 -1216.07
06/19 5 Day +0709.68 -0131.45 -0280.74 +0235.56 +0051.43 -0738.39
06/20 5 Day +0420.82 -0830.63 -0335.20 -0127.15 -0490.98 -0800.14
06/21 5 Day -0104.07 -0937.31 -0559.60 -0654.35 -0909.03 -1058.29
06/24 5 Day -0477.95 -0352.25 -0651.10 -0782.03 -0852.94 -1162.22
06/25 5 Day -0849.84 -0362.36 -1111.93 -0897.32 -1175.50 -1363.93
06/26 5 Day -1138.27 -0428.60 -1445.69 -1100.60 -1534.70 -1277.27
06/27 5 Day -0308.37 +0112.46 -1165.80 -0667.45 -1134.54 -0857.51
06/28 5 Day +0286.89 +0182.83 -1050.29 -0220.74 -0806.64 -0430.62
Average % change/day, 5 days
____ **5 Day *10 Day *25 Day *50 Day 100 Day 200 Day
05/22 -023.94 -036.64 +058.06 +170.02 +016.05 +187.60
05/24 -016.72 -008.38 +229.27 +161.44 -115.55 +231.54
05/28 +049.87 +014.78 +159.03 +145.29 -125.91 +178.19
05/29 +080.66 +086.51 +138.36 +125.49 -009.25 +133.13
05/30 -067.44 +165.39 +047.70 +095.90 -144.59 +056.26
05/31 -147.96 +188.23 -052.09 +056.32 -169.81 -024.64
06/03 -072.96 +156.98 -149.39 +052.16 -132.43 +011.44
06/04 -130.55 -006.04 -120.98 -090.34 -091.24 +012.99
06/05 +035.19 -126.52 -191.18 -173.07 -226.10 -129.53
06/06 -079.38 -146.82 -035.57 -144.20 -164.61 -105.91
06/07 -055.20 -203.16 -014.48 -131.49 -057.72 -262.45
06/10 +166.38 +026.12 -121.81 -247.75 -019.36 -485.30
06/11 +237.10 +193.27 +104.03 -113.29 -207.84 -625.81
06/12 -289.41 +324.61 -214.80 -113.65 -118.64 -543.76
06/13 +292.66 +298.02 +167.79 -158.46 -026.30 -530.90
06/14 -254.18 +334.16 +212.34 -061.78 +036.22 -196.38
06/17 -174.89 -341.27 -089.84 +160.91 -095.02 +068.31
06/18 -096.25 -333.35 -274.75 +120.05 +315.65 +251.41
06/19 +310.16 -315.70 +142.45 +152.26 +342.66 +399.64
06/20 -166.13 -458.79 -346.63 +102.36 +149.16 +392.60
06/21 +145.83 -441.64 -383.70 -064.31 +005.41 +208.75
06/24 -120.73 +104.44 +027.74 -214.11 +077.74 +074.54
06/25 -267.46 +023.78 -132.64 -231.50 -212.98 -029.57
06/26 -369.59 -059.43 -232.99 -267.23 -317.23 -107.77
06/27 -145.84 +188.62 -166.12 -108.06 -128.71 -011.47
06/28 +078.19 +224.03 -098.14 +086.72 +020.48 +125.53
I encourage those with an interest to look at the charts and notice the prior patterns similar to the current one and the resulting price activity.
Dly Sht % of 'sells' values JIC it turns out to be useful...
Wed., 8/01: 2.37% 46.91% 0.00%
Mon., 8/06: 19.99% 33.11% 3.34% 73.89% 33.88%
Mon., 8/13: 25.13% 3.06% 71.64% 50.47% 393.87%
Mon., 8/20: 129.14% 155.71% 899.39% 137.13% 209.19%
Mon., 8/27: 34.71% 61.1% 107.48% 24.28% 104.22%
Tue., 9/4 148.07% 28.40% 16.32% 3.01%
Mon. 9/10: 23.65% 50.20% 26.05% 252.39% 185.99%
Mon. 9/17: 32.74% 12.62% 12.85% 42.25% 42.89%
Mon. 9/24: 5.08% 50.67% 89.56% 9.24% 44.74%
Mon. 10/1: 74.24% 67.10% 517.63% 102.93%
Mon. 10/8: 28.10% 27.40% 11.45% 27.48% 25.32%
Mon. 10/15: 44.06% 17.09% 71.49% 40.64% 139.27%
Mon. 10/22: 194.20% 19.54% 25.53% 15.21% 15.17%
Wed. 10/31: 62.24% 149.46% 39.90%
Mon. 11/05: 30.92% 7.61% 6.98% 3.53% 10.10%
Mon. 11/12: 4.01% 116.57% 30.19% 16.71% 39.58%
Mon. 11/19: 14.90% 3.88% 259.67% T'gvg Day 8.97% (1/2 day)
Mon. 11/26: 65.57% 142.31% 59.83% 11.20% 69.26%
Mon. 12/03: 29.97% 13.19% 10.55% 15.57% 40.42%
Mon. 12/10: 3.59% 9.24% 135.35% 6.19% 12.73%
Mon. 12/17: 26.17% 8.82% 44.97% 3.63% 15.11%
Mon. 12/24: 258.33% 92.71% 31.98% 1.54%
Mon. 12/31: 14.36% H'lday 262.58% 6.39% 131.03%
Mon. 01/07: 45.09% 77.18% 52.53% 36.35% 52.72%
Mon. 01/14: 27.99% 0.70% 48.48% 11.09% 11.21%
Tues. 01/22: 00.26% 23.79% 12.89% 8.36%
Mon. 01/28: 69.26% 42.03% 7.96% 0.00% 28.33%
Mon. 02/04: 17.36% 28.73% 18.53% 12.68% 39.65%
Mon. 02/11: 25.67% 5.99% 16.57% 17.04% 8.23%
Tues. 02/19: 19.57% 19.88% 10.17% 30.54%
Mon. 02/25: 2.88% 55.65% 28.57% 6.95% 0.28%
Mon. 03/04: 100.79% 18.46% 11.55% 21.97% 3.61%
Mon. 03/11: 25.81% 9.64% 1.35% 13.40% 0.00%
Mon. 03/18: 7.10% 5.65% 9.26% 25.15% 9.02%
Mon. 03/25: 1.47% 14.69% 4.15% 25.64%
Mon. 04/01: 4.74% 11.82% 19.85% 3.42% 0.59%
Mon. 04/08: 8.01% 9.51% 13.54% 0.00% 6.62%
Mon. 04/15: 2.68% 8.94% 5.64% 1.67% 18.45%
Mon. 04/22: 0.42% 4.90% 690.95% 39.86% 22.22%
Mon. 04/29: 5.98% 14.04% 17.33% 13.58% 150.50%
Mon. 05/06: 9.96% 9.15% 114.65% 53.10% 39.36%
Mon. 05/13: 33.94% 54.27% 29.90% 61.57% 104.44%
Mon. 05/20: 92.10% 132.60% 34.23% 55.97%
Tue. 05/28: 76.82% 109.81% 28.64% 150.02%
Mon. 06/03: 62.23% 62.24% 44.26% 98.99% 27.30%
Mon. 06/10: 26.26% 40.92% 28.42% 82.06% 81.55%
Mon. 06/17: 49.37% 57.96% 18.60% 26.64% 25.50%
Mon. 06/24: 43.95% 23.12% 22.40% 46.88% 15.07%
Feb Avg: 54.68%, min: 0.35%, max: 200.89%
Mar Avg: 49.86%, min: 0.70%, max: 252.30%
Apr Avg: 31.50%, min: 0.00%, max: 74.35%
May Avg: 62.73%, min: 0.00%, max: 398.94%
Then the Mega-C shares entered market? Note the hefty change in both the averages and maximums.
Jun Avg: Avg: 183.48%, min: 5.05%, max: 1607.50%
Jul Avg: 176.07%, min: 7.75%, max: 1273.20%
Sometime in August I began stating that I thought the larger sellers might be getting exhausted.
Aug Avg: 113.91%, min: 0.00%, max: 899.39%
Sep Avg: 56.67%, min: 3.01%, max: 252.39%
Oct Avg: 85.05%, min: 11.45%, max: 565.73%
Nov Avg: 51.96%, min: 3.53%, max: 259.67%
Dec Avg: 38.72%, min: 1.54%, max: 258.33%
============ 2013 ===============
Jan Avg: 44.20%, min: 0.00%, max: 262.58%
Feb Avg: 20.90%, min: 2.88%, max: 55.65%
Mar Avg: 15.42%, min: 0.00%, max: 100.79%
Apr Avg: 40.63%, min: 0.00%, max: 690.95%
May Avg: 67.58%, min: 9.15%, max: 150.50%
Jun Avg: 47.48%, min: 15.07%, max: 98.99%
0628 Vol 0512780, Sht 0046477 09.06% LHC 0.1421 0.1550 0.1532 b:s 1:1.64
0627 Vol 1298856, Sht 0297000 22.87% LHC 0.1390 0.1579 0.1517 b:s 1.06:1[73]
0626 Vol 0898970, Sht 0145356 16.17% LHC 0.1400 0.1600 0.1599 b:s 1:2.50[72]
0625 Vol 0555717, Sht 0094600 17.02% LHC 0.1550 1.1700 0.1550 b:s 1:3.00[71]
0624 Vol 0598247, Sht 0145110 24.26% LHC 0.1620 0.1800 0.1699 b:s 1:1.39
0621 Vol 0808784, Sht 0146900 18.16% LHC 0.1700 0.1900 0.1740 b:s 1:2.78
0620 Vol 0735033, Sht 0146500 19.93% LHC 0.1850 0.1990 0.1871 b:s 1:3.22
0619 Vol 0295911, Sht 0043900 14.84% LHC 0.1900 0.1999 0.1980 b:s 1:4.11
0618 Vol 0187360, Sht 0065840 35.14% LHC 0.1920 0.2000 0.1950 b:s 1:2.17[70]
0617 Vol 0436047, Sht 0141509 32.45% LHC 0.1951 0.2120 0.2000 b:s 1:1.92
0614 Vol 0742259, Sht 0310280 41.80% LHC 0.1970 0.2650 0.2010 b:s 1:1.06
0613 Vol 0433078, Sht 0158507 36.60% LHC 0.1902 0.2000 0.1970 b:s 1.18:1
0612 Vol 0532910, Sht 0107142 20.11% LHC 0.1900 0.2000 0.1997 b:s 1:3.12[69]
0611 Vol 1293346, Sht 0309200 23.91% LHC 0.1900 0.2180 0.2000 b:s 1:1.41[68]
0610 Vol 1314871, Sht 0246507 18.75% LHC 0.2100 0.2349 0.2120 b:s 1:2.45[67]
0607 Vol 0781176, Sht 0131800 16.87% LHC 0.2201 0.2500 0.2350 b:s 1:1.70
0606 Vol 0554985, Sht 0192595 34.70% LHC 0.2500 0.2639 0.2500 b:s 1.82:1
0605 Vol 0218283, Sht 0072968 33.43% LHC 0.2530 0.2601 0.2585 b:s 1:3.09
0604 Vol 0077889, Sht 0030500 39.16% LHC 0.2605 0.2719 0.2605 b:s 1:1.70
0603 Vol 0296541, Sht 0095000 32.04% LHC 0.2700 0.2775 0.2726 b:s 1:1.12[66]
0531 Vol 0180950, Sht 0098765 54.58% LHC 0.2611 0.2775 0.2775 b:s 1.38:1[65]
0530 Vol 0221542, Sht 0049700 22.43% LHC 0.2650 0.2739 0.2739 b:s 1:3.62
0529 Vol 0518608, Sht 0199204 38.41% LHC 0.2526 0.2750 0.2720 b:s 1.89:1[64]
0528 Vol 0538254, Sht 0132592 24.63% LHC 0.2540 0.2660 0.2600 b:s 2.23:1[63]
0524 Vol 0155897, Sht 0056184 36.04% LHC 0.2602 0.2690 0.2611 b:s 1:1.63[62]
0523 Vol 0109249, Sht 0033000 30.21% LHC 0.2550 0.2960 0.2690 b:s 2.89:1[61]
0522 Vol 0167469, Sht 0031100 18.57% LHC 0.2520 0.2650 0.2600 b:s 1:1.23
0521 Vol 0185758, Sht 0086259 46.44% LHC 0.2531 0.2640 0.2600 b:s 1.68:1
0520 Vol 0355550, Sht 0135850 38.21% LHC 0.2510 0.2615 0.2600 b:s 1.41:1
0517 Vol 0261558, Sht 0092700 35.44% LHC 0.2500 0.2640 0.2591 b:s 1.78:1
0516 Vol 0641735, Sht 0218208 34.00% LHC 0.2460 0.2690 0.2500 b:s 1:1.30
0515 Vol 0370415, Sht 0078250 21.12% LHC 0.2390 0.2500 0.2430 b:s 1:2.41
0514 Vol 0590688, Sht 0178460 30.21% LHC 0.2210 0.2510 0.2500 b:s 1:1.32
0513 Vol 0778100, Sht 0155500 19.98% LHC 0.2350 0.2500 0.2460 b:s 1:1.70
0510 Vol 0270484, Sht 0066455 24.57% LHC 0.2401 0.2500 0.2480 b:s 1:1.67
0509 Vol 0304708, Sht 0068700 22.55% LHC 0.2451 0.2592 0.2459 b:s 1.35:1
0508 Vol 1143057, Sht 0539744 47.22% LHC 0.2300 0.2650 0.2549 b:s 1.45:1
0507 Vol 0129978, Sht 0005424 04.17% LHC 0.2560 0.2625 0.2600 b:s 1.19:1
0506 Vol 0211234, Sht 0010924 05.17% LHC 0.2550 0.2698 0.2698 b:s 1:1.08
0503 Vol 0183500, Sht 0076000 41.42% LHC 0.2500 0.2598 0.2590 b:s 2.63:1
0502 Vol 0184550, Sht 0018850 10.21% LHC 0.2410 0.2600 0.2600 b:s 1:3.04
0501 Vol 0301628, Sht 0032500 10.77% LHC 0.2400 0.2795 0.2610 b:s 1:1.64
0430 Vol 0407902, Sht 0021880 05.36% LHC 0.2101 0.2549 0.2390 b:s 1.57:1
0429 Vol 1332379, Sht 0051500 03.87% LHC 0.2001 0.2440 0.2119 b:s 1:1.83
0426 Vol 0133648, Sht 0016000 11.97% LHC 0.2324 0.2499 0.2449 b:s 1:1.27
0425 Vol 0191550, Sht 0061000 31.85% LHC 0.2400 0.2500 0.2400 b:s 1:3.97
0424 Vol 0161622, Sht 0067022 41.47% LHC 0.2450 0.2500 0.2500 b:s 13.29:1
0423 Vol 0070533, Sht 0000833 01.18% LHC 0.2401 0.2500 0.2500 b:s 3.15:1
0422 Vol 0240850, Sht 0000550 00.23% LHC 0.2400 0.2559 0.2401 b:s 1:1.20
0419 Vol 0515507, Sht 0078791 15.28% LHC 0.2321 0.2603 0.2450 b:s 1:4.83
0418 Vol 0295580, Sht 0004500 01.20% LHC 0.2600 0.2625 0.2600 b:s 1:136.86
0417 Vol 0115060, Sht 0005275 04.58% LHC 0.2600 0.2750 0.2600 b:s 1:4.35
0416 Vol 0161636, Sht 0009600 05.94% LHC 0.2601 0.2700 0.2601 b:s 1:1.98
0415 Vol 0253015, Sht 0005800 02.29% LHC 0.2600 0.2629 0.2601 b:s 1:5.89
0412 Vol 0091300, Sht 0004500 04.93% LHC 0.2601 0.2739 0.2622 b:s 1:2.92
0411 Vol 0146890, Sht 0000000 00.00% LHC 0.2600 0.2629 0.2604 b:s 1:2.08[60]
0410 Vol 0106016, Sht 0010900 10.28% LHC 0.2605 0.2669 0.2639 b:s 1:3.15
0409 Vol 0217371, Sht 0012500 05.75% LHC 0.2611 0.2725 0.2650 b:s 1:1.53
0408 Vol 0196151, Sht 0011200 05.71% LHC 0.2600 0.2800 0.2600 b:s 1:2.48
0405 Vol 0360500, Sht 0001700 00.47% LHC 0.2600 0.2960 0.2648 b:s 1:4.04
0404 Vol 0446792, Sht 0011884 02.66% LHC 0.2602 0.2950 0.2855 b:s 1:3.52
0403 Vol 0100000, Sht 0010300 10.30% LHC 0.2600 0.2699 0.2675 b:s 1:1.08
0402 Vol 0262385, Sht 0024245 09.24% LHC 0.2550 0.2699 0.2650 b:s 1:3.58
0401 Vol 0323220, Sht 0014100 04.36% LHC 0.2600 0.2849 0.2800 b:s 1:11.63
[60] An AH 50K trade is not included in the FINRA data. Including that in the volume has no effect because reported short sales were zero. If we also include it in short sales, the short percentage moves to 25.39%. However, with the recent daily short sales so low, there's no reason to believe these were a short sale.[61] An AH trade of 5.1K is not included in the FINRA daily short sales. Including it in day's volume 28.86%, Including it as short volume as well yields 33.32% .
[61] An AH trade of 5.1K is not included in the FINRA daily short sales. Including it in day's volume 28.86%, Including it as short volume as well yields 33.32%.
[62] Second day in a row an AH trade below the close: manipulation suspected. See this comment.
The FINRA data does not include the AH trade of 6K. Adding this to the day's volume moves the short percentage from the FINRA-based 36.04% to 34.70%. If we also add it to short sales, the percentage moves to 38.41%.
[63] The FINRA data does not include an AH trade of 19.7K. Including it moves the FINRA-reported short percentage from 24.63% to 23.76%. If it's also added to short sales, the short volume moves to 152,292 and percentage moves to 27.29%.
[64] The FINRA data excludes a 10K AH trade. Including it in the day's volume would move daily short percentage from 38.41% to 37.68%. Including it also in the daily short volume would move volume from 199204 to 209,204 and percentage from 38.41% to 39.58%.
[65] The FINRA data excludes a 10K AH trade. Including it in the day's volume would move daily short percentage from 54.58% to 51.72%. Including it also in the daily short volume would move volume from 98765 to 108765 and percentage from 54.58% to 59.96%.
[66] The FINRA data excludes a 5K AH trade. Including it in the day's volume would move daily short percentage from 32.04% to 31.50%. Including it also in the daily short volume would move volume from 95K to 100K and percentage from 32.04% to 33.16%.
[67] Finra data excludes two AH trades, 10593 and 5K, totaling 15593, both at $0.21. Adding them to the volume moves the Finra-reported volume from 1314871 to 1330464, and the short percentage from the FINRA-based calculated 18.75% to 18.53%. If we also add it to the daily short sales, the short sales move to 262100 from the FINRA-reported 246507 and the short percentage moves to 19.70%.
[68] Three AH trades at $0.20 of 8K, 8K and 2.5K are not included in FINRA daily short sales. Including that volume moves FINRA-reported daily volume from 1,293,346 to 1,311,846 and short percentage from 23.91% to 23.57%. If we also include them in the daily short sales, daily shorts goes to 327,700 and short percentage moves to 24.98%.
[69] A very unusual trade before the open ($0.20x2.5K) and one after the close ($0.1935x2.5K) do not appear on the FINRA data. Adding these to Finra's total volume would move it from 532,910 to 537,910 and reduce the short percentage from 20.11% to 19.92%. If we also add it to the day short sales, short volume moves from 107,142 to 112,142 and short percentage moves to 20.85%.
[70] A 2K AH trade is not included in the FINRA-reported volumes. Adding this to the days volume move the volume from 187,360 to 189,360 and the short percentage from 35.14% to 34.77%. If the 2K is also added to daily short sales, the short volume moves from 65,840 to 67,840 and short percentage to 35.83%.
[71] A 15K AH trade is not included in FINRA data. Adding it to total volume moves the volume from the reported 555,717 to 570,717 and the short percentage from 17.02% to 16.58%. If the sahres are also added to the short sales, the short volume moves to 109,600 and the short percentage to 19.20%.
[72] A 15K AH trade is not included in FINRA data. Adding it to total volume moves the volume from the reported 898,970 to 913,970 and the short percentage from 16.17% to 15.90%. If the shares are also added to the short sales, the short volume moves to 160,356 and the short percentage to 17.54%.
[73] Two out-of-hours trades, a 5K pre-market and a 15K after-hours trade, are not included in FINRA data. Adding them to total volume moves the volume from the reported 1,298,856 shares to 1,313,856 and the short percentage from 22.87% to 22,61%. If they are also added to the short sales, the short volume moves to 312,000 and the short percentage to 23.75%.
06/27/2013: EOD stuff partially copied to the concentrator.
# Trds: 160, MinTrSz: 500, MaxTrSz: 70000, Vol 1313856, AvTrSz: 8212
Min. Pr: 0.1390, Max Pr: 0.1579, VW Avg. Tr. Pr:0.1495
# Buys, Shares: 68 670390, VW Avg Buy Pr: 0.1511
# Sells, Shares: 89 633466, VW Avg Sell Pr: 0.1478
# Unkn, Shares: 3 10000, VW Avg Unk. Pr: 0.1430
Buy:Sell 1.06:1 (51.0% "buys"), DlyShts 297000 (22.61%), Dly Sht % of 'sells' 46.88%
06/27: 85% x avg. of 20 lowest intra-day VWAPs, $0.2005, in 40 days: $0.1704
Prior recent calculations of estimated next share issue price:
06/14: 85% x avg. of 20 lowest intra-day VWAPs, $0.2315, in 40 days: $0.1968
06/17: 85% x avg. of 20 lowest intra-day VWAPs, $0.2292, in 40 days: $0.1948
06/18: 85% x avg. of 20 lowest intra-day VWAPs, $0.2266, in 40 days: $0.1926
06/19: 85% x avg. of 20 lowest intra-day VWAPs, $0.2242, in 40 days: $0.1906
06/20: 85% x avg. of 20 lowest intra-day VWAPs, $0.2214, in 40 days: $0.1882
06/21: 85% x avg. of 20 lowest intra-day VWAPs, $0.2176, in 40 days: $0.1850
06/24: 85% x avg. of 20 lowest intra-day VWAPs, $0.2147, in 40 days: $0.1825
06/25: 85% x avg. of 20 lowest intra-day VWAPs, $0.2103, in 40 days: $0.1788
06/26: 85% x avg. of 20 lowest intra-day VWAPs, $0.2053, in 40 days: $0.1745
WVAP's continue the trend:
$0.2122, $0.1999, $0.1963, $0.1961, $0.1925, $0.1751, $0.1710, $0.1619, $0.1497 & today's $0.1495.
Do note that the VWAP decline today breaks the trend in that it's decline is minuscule. More on that later.
Volumes, in thousands: 742.26, 436.05, 189.36, 295.91, 735.03, 808.78, 598.25, 913.97 and 1,313.86.
Two out-of-hours trades, a 5K pre-market and a 15K after-hours trade, are not included in FINRA data. Adding them to total volume moves the volume from the reported 1,298,856 shares to 1,313,856 and the calculated short percentage from 22.87% to 22,61%. If they are also added to the short sales, the short volume moves to 312,000 and the calculated short percentage to 23.75%.
Note the buy:sell percentage today is a big change from the recent trend: 52.63%, 48.34%, 34.26%, 27.68%, 19.41%, 23.25%, 25.63%, 39.79%, 23.92%, 28.39% and today's 51.02%. The initial reaction is to start turning handsprings. But not so quick there Homer! Is it reasonable that 670.4K shares were "buys" today at a VWAP of $0.1511 when yesterday (Wednesday) we couldn't seemingly pay folks to take more than 259,474 shares (the "buys") at $0.1498 on a 914K day? I believe, based on the sound counsel of my venerable TFH, that a combination of EOM/EOQ "window dressing" season and a relatively large volume of prior "real" short sales (not the normal MM daily short sales), may have combined to produce today's effect. I *suspect* that a shorter was completing covering buys today, booking profits for the quarter and assuring a favorable review for the quarterly performance.
I believe that's why price decline was so much smaller today than the trend would suggest it should be.
In all fairness, I should acknowledge that it's entirely reasonable to consider that a sudden spate of bullishness enveloped folks that had been awaiting a favorable price. This would negate my theory of short covering, which is based on the 800K+ short report for 5/31 (recall that it couldn't be a result of T+3 effects and normal MM shorting while the 5/15 and 6/14 reports, ~171K and ~1.2MM respectively, weren't that concerning to me because they could have been just an effect of normal MM shorting and T+3 settlement - not enough information to form a firm conspiracy theory ;-)). We'll have to ignore how close the quantity of today's "buys" were to any estimated difference between the ~800K and "normal" though. Some part of that 800K would be normal MM shorting. The 10-day averages 5/24-6/6 hit a short-term peak during the period though: 30.75%, 31.13%, 31.88%, 32.01%, 34.31%, 33.91%, 34.01%, 32.71% and 34.32%, and the daily percentages for the period did the same: 34.70%, 23.76%, 37.68%, 22.43%, 56.96%, 31.50%, 39.16%, 33.43% and 34.70%. The short volume for 5/28-5/31, in thousands: 132.59, 199.20, 49.70 and 108.77. For the subsequent four days: 95.00, 30.50, 72.97 and 192.60.
Regarding my original experimental inflection point calculations, five of the six periods showed small improved one-day changes, due to the combination of volume and a stronger buy percentage, as did the change over five days. The average change over the five days had all six periods improving. I do want to emphasize these are only generally showing reducing rates of weakening presently, not showing strengthening.
The newer version of those calculations has all six periods' changes showing improved values for both the one-day and five-day periods and for the average rate of change over the five days. As with the original version, it's reducing rate of weakening we see for now, not strengthening.
Details of "Dly Sht % of 'sells'" and inflection points are in the latest daily post above.
06/26/2013: EOD stuff partially copied to the concentrator.
# Trds: 129, MinTrSz: 100, MaxTrSz: 54500, Vol 913970, AvTrSz: 7085
Min. Pr: 0.1400, Max Pr: 0.1600, VW Avg. Tr. Pr: 0.1497
# Buys, Shares: 44 259474, VW Avg Buy Pr: 0.1498
# Sells, Shares: 83 648929, VW Avg Sell Pr: 0.1496
# Unkn, Shares: 2 5567, VW Avg Unk. Pr: 0.1551
Buy:Sell 1:2.50 (28.4% "buys"), DlyShts 145356 (15.90%), Dly Sht % of 'sells' 22.40%
06/26: 85% x avg. of 20 lowest intra-day VWAPs, $0.2053, in 40 days: $0.1745
Prior recent calculations of estimated next share issue price:
06/14: 85% x avg. of 20 lowest intra-day VWAPs, $0.2315, in 40 days: $0.1968
06/17: 85% x avg. of 20 lowest intra-day VWAPs, $0.2292, in 40 days: $0.1948
06/18: 85% x avg. of 20 lowest intra-day VWAPs, $0.2266, in 40 days: $0.1926
06/19: 85% x avg. of 20 lowest intra-day VWAPs, $0.2242, in 40 days: $0.1906
06/20: 85% x avg. of 20 lowest intra-day VWAPs, $0.2214, in 40 days: $0.1882
06/21: 85% x avg. of 20 lowest intra-day VWAPs, $0.2176, in 40 days: $0.1850
06/24: 85% x avg. of 20 lowest intra-day VWAPs, $0.2147, in 40 days: $0.1825
06/25: 85% x avg. of 20 lowest intra-day VWAPs, $0.2103, in 40 days: $0.1788
WVAP's continue the trend:
$0.2122, $0.1999, $0.1963, $0.1961, $0.1925, $0.1751, $0.1710, $0.1619 & today's $0.1497
Volumes, in thousands: 742.26, 436.05, 189.36, 295.91, 735.03, 808.78, 598.25 and 913.97.
A 15K AH trade is not included in FINRA data. Adding it to total volume moves the volume from the reported 898,970 to 913,970 and the short percentage from 16.17% to 15.90%. If the shares are also added to the short sales, the short volume moves to 160,356 and the short percentage to 17.54%.
Similar to yesterday, all my original inflection point calculations have increased weakening in the one-day changes, five of the six five day changes (the 200-day being the exception), and the average rate of change over the five days worsening.
My newer version has all six one-day and five-day changes weakening and four of the six average rate of change over the five days weakening with only the fifty and 200-day showing an insignificant improvement.
Details of "Dly Sht % of 'sells'" and inflection points are in the latest daily post above.
06/25/2013: EOD stuff partially copied to the concentrator.
# Trds: 105, MinTrSz: 100, MaxTrSz: 53992, Vol 570717, AvTrSz: 5435
Min. Pr: 0.1550, Max Pr: 1.1700, VW Avg. Tr. Pr: 0.1619
# Buys, Shares: 33 136500, VW Avg Buy Pr: 0.1651
# Sells, Shares: 69 409217, VW Avg Sell Pr: 0.1608
# Unkn, Shares: 3 25000, VW Avg Unk. Pr: 0.1633
Buy:Sell 1:3.00 (23.9% "buys"), DlyShts 94600 (16.58%), Dly Sht % of 'sells' 23.12%
06/25: 85% x avg. of 20 lowest intra-day VWAPs, $0.2103, in 40 days: $0.1788
Prior recent calculations of estimated next share issue price:
06/14: 85% x avg. of 20 lowest intra-day VWAPs, $0.2315, in 40 days: $0.1968
06/17: 85% x avg. of 20 lowest intra-day VWAPs, $0.2292, in 40 days: $0.1948
06/18: 85% x avg. of 20 lowest intra-day VWAPs, $0.2266, in 40 days: $0.1926
06/19: 85% x avg. of 20 lowest intra-day VWAPs, $0.2242, in 40 days: $0.1906
06/20: 85% x avg. of 20 lowest intra-day VWAPs, $0.2214, in 40 days: $0.1882
06/21: 85% x avg. of 20 lowest intra-day VWAPs, $0.2176, in 40 days: $0.1850
06/24: 85% x avg. of 20 lowest intra-day VWAPs, $0.2147, in 40 days: $0.1825
WVAP's continue the trend:
$0.2122, $0.1999, $0.1963, $0.1961, $0.1925, $0.1751, $0.1710 & today's 0.1619.
Volumes, in thousands: 742.26, 436.05, 189.36, 295.91, 735.03, 808.78 and 598.25.
A 15K AH trade is not included in FINRA data. Adding it to total volume moves the volume from the reported 555,717 to 570,717 and the short percentage from 17.02% to 16.58%. If the shares are also added to the short sales, the short volume moves to 109,600 and the short percentage to 19.20%.
My original experimental inflection point calculations have every number weakening.
My newer version agrees except that the five-day change of the 10-day calculation had a minuscule improvement from -0151.37 to -0150.57. The additional factors considered make the overall weakening seem a bit less dramatic.
Details of "Dly Sht % of 'sells'" and inflection points are in the latest daily post above.
06/24/2013: EOD stuff partially copied to the concentrator.
# Trds: 114, MinTrSz: 176, MaxTrSz: 50000, Vol 598247, AvTrSz: 5248
Min. Pr: 0.1620, Max Pr: 0.1800, VW Avg. Tr. Pr: 0.1710
# Buys, Shares: 42 238048, VW Avg Buy Pr: 0.1711
# Sells, Shares: 69 330179, VW Avg Sell Pr: 0.1706
# Unkn, Shares: 3 30020, VW Avg Unk. Pr: 0.1744
Buy:Sell 1:1.39 (39.8% "buys"), DlyShts 145110 (24.26%), Dly Sht % of 'sells' 43.95%
06/24: 85% x avg. of 20 lowest intra-day VWAPs, $0.2147, in 40 days: $0.1825
Today has one positive metric: buy:sell.
Prior recent calculations of estimated next share issue price:
06/14: 85% x avg. of 20 lowest intra-day VWAPs, $0.2315, in 40 days: $0.1968
06/17: 85% x avg. of 20 lowest intra-day VWAPs, $0.2292, in 40 days: $0.1948
06/18: 85% x avg. of 20 lowest intra-day VWAPs, $0.2266, in 40 days: $0.1926
06/19: 85% x avg. of 20 lowest intra-day VWAPs, $0.2242, in 40 days: $0.1906
06/20: 85% x avg. of 20 lowest intra-day VWAPs, $0.2214, in 40 days: $0.1882
06/21: 85% x avg. of 20 lowest intra-day VWAPs, $0.2176, in 40 days: $0.1850
WVAP's continue the trend:
$0.2122, $0.1999, $0.1963, $0.1961, $0.1925, $0.1751 and today's $0.1710.
Volumes, in thousands: 742.26, 436.05, 189.36, 295.91, 735.03, 808.78 and 598.25.
There was some improvement in the one-day change on my original inflection point calculations, but in the current environment I don't think we should consider them much, so I won't detail them. My newer version is a little more optimistic, meaning only that the rate of negative movement is reducing, but again not worthy of discussion in the current environment.
Details of "Dly Sht % of 'sells'" and inflection points are in the latest daily post above.
06/21/2013: EOD stuff partially copied to the concentrator.
# Trds: 121, MinTrSz: 220, MaxTrSz: 56573, Vol 808784, AvTrSz: 6684
Min. Pr: 0.1700, Max Pr: 0.1900, VW Avg. Tr. Pr: 0.1751
# Buys, Shares: 48 207300, VW Avg Buy Pr: 0.1767
# Sells, Shares: 69 576084, VW Avg Sell Pr: 0.1744
# Unkn, Shares: 4 25400, VW Avg Unk. Pr: 0.1796
Buy:Sell 1:2.78 (25.6% "buys"), DlyShts 146900 (18.16%), Dly Sht % of 'sells' 25.50%
06/21: 85% x avg. of 20 lowest intra-day VWAPs, $0.2176, in 40 days: $0.1850
The last line above and the following five say almost all needing saying I think.
06/14: 85% x avg. of 20 lowest intra-day VWAPs, $0.2315, in 40 days: $0.1968
06/17: 85% x avg. of 20 lowest intra-day VWAPs, $0.2292, in 40 days: $0.1948
06/18: 85% x avg. of 20 lowest intra-day VWAPs, $0.2266, in 40 days: $0.1926
06/19: 85% x avg. of 20 lowest intra-day VWAPs, $0.2242, in 40 days: $0.1906
06/20: 85% x avg. of 20 lowest intra-day VWAPs, $0.2214, in 40 days: $0.1882
If my math is correct ...
The match, reinforcing the above, is VWAP.
$0.2122, $0.1999, $0.1963, $0.1961, $0.1925 and today's $0.1751.
Add in volume, in thousands: 742.26, 436.05, 189.36, 295.91, 735.03 and 808.78.
Details of "Dly Sht % of 'sells'" and inflection points are in the latest daily post above.
06/20/2013: EOD stuff partially copied to the concentrator.
# Trds: 107, MinTrSz: 400, MaxTrSz: 40000, Vol 735033, AvTrSz: 6869
Min. Pr: 0.1850, Max Pr: 0.1990, VW Avg. Tr. Pr:0.1925
# Buys, Shares: 20 170898, VW Avg Buy Pr: 0.1940
# Sells, Shares: 85 550012, VW Avg Sell Pr: 0.1920
# Unkn, Shares: 2 14123, VW Avg Unk. Pr: 0.1925
Buy:Sell 1:3.22 (23.3%),DlyShts 146500 (19.93%), Dly Sht % of 'sells' 26.64%
06/20: 85% x avg. of 20 lowest intra-day VWAPs, $0.2214, in 40 days: $0.1882
Average trade size might look encouraging until you consider that the standard "present" size is now at 5K, rather than the 2.5K we saw when we traded consistently above $0.20. Today we had 24 of our trades that were >= 10K in size and 10 that were 15K-40K. My feeling (not done any math on it) is that this is a much higher percentage of "larger" trades than is normal. With this in mind, I don't read anything bullish into increasing average trade size.
Price spread a bit wider today, unfortunately to the wrong side. Here's a breakdown.
$0.1850-$0.1899: 139200 shares, 18.94% of vol, VWAP $0.1873, b:s 1:4.22, 18.5% buys
$0.1900-$0.1945: 334626 shares, 45.53% of vol, VWAP $0.1915, b:s 1:4.06, 19.8% buys
$0.1950-$0.1990: 261207 shares, 35.54% of vol, VWAP $0.1964, b:s 1:2.19, 30.3% buys
Here you can see the appearance of what we've very often seen for a long time, "late-day weakness". Some things seldom change. Compare it to the price breakdown above and you can tell where the lowest prices came in.
09:30-09:56: 024009 shares, 03.27% of vol, VWAP $0.1983, 29.2% buys
10:11-10:47: 084498 shares, 11.50% of vol, VWAP $0.1980, 22.4% buys
11:01-11:59: 192654 shares, 26.21% of vol, VWAP $0.1941, 22.4% buys
12:01-12:36: 031000 shares, 04.22% of vol, VWAP $0.1936, 64.5% buys
13:07-13:51: 062600 shares, 08.52% of vol, VWAP $0.1928, 31.9% buys
14:01-14:53: 207572 shares, 28.24% of vol, VWAP $0.1903, 17.4% buys
15:01-15:52: 132700 shares, 18.05% of vol, VWAP $0.1884, 19.4% buys
There's really not much different - continued increasing selling pressure, decreasing price per share, ... So I'll be unusually brief.
My original and newer inflection points reflect this so detailing them seems a waste for now. Of the 18 numbers I look at on my original version, only one had the unmitigated gall to show a positive move. I will not name that one here to protect it from public embarrassment. My newer version is more pessimistic - there are no dissenters.
Details of "Dly Sht % of 'sells'" and inflection points are in the latest daily post above.
06/19/2013: EOD stuff partially copied to the concentrator.
# Trds: 67, MinTrSz: 200, MaxTrSz: 22500, Vol 295911, AvTrSz: 4417
Min. Pr: 0.1900, Max Pr: 0.1999, VW Avg. Tr. Pr: 0.1961
# Buys, Shares: 10 57425, VW Avg Buy Pr: 0.1991
# Sells, Shares: 56 235986, VW Avg Sell Pr: 0.1954
# Unkn, Shares: 1 2500, VW Avg Unk. Pr: 0.1965
Buy:Sell 1:4.11 (19.4% "buys"), DlyShts 43900 (14.84%), Dly Sht % of 'sells' 18.60%
06/19: 85% x avg. of 20 lowest intra-day VWAPs, $0.2242, in 40 days: $0.1906
Daily short sales percentage was a bit lower than recently. I attribute this to ATDF being top of the ask four times out of ten peeks at the ask since we know that when ATDF dominated the offers stack in the past, for an extended period, we had extremely low daily short sales percentages. They were showing asks in second place two additional times. This implies that ATDF-related "sells", hitting the bids, were likely also higher, accounting for the much lower than normal "Dly Sht % of 'sells'". This leads me to gain stronger confidence that ATDF does hold small short-term long positions as well because otherwise their "sells" would increase the "Dly Sht % of 'sells'". ARCA and BTIG were atop the offers stack seven times (sometimes co-located with ATDF).
Around 14:15, I saw CDEL with a bid of $0.198x97K, but it wasn't top of the heap. But by 14:19 it was spending some time up there. The VWAP from 14:19 on was $0.1983 vs the $0.1948 in the 39 trades prior to that time. That's the upside. The downside is it stirred the sellers' hornets nest as they decided this was a great price and hit the bids hard - 83.35% of the volume were sells, vs. 77.41 percent prior to that.
That tells us something about the sentiment of the sellers, no?
A small, and maybe inconsequential, piece of good news was that the folks making offers, rather than just hitting the bids from the sell side, were more disciplined about their price even with ATDF, the "me first" MM, being near the top a lot of the time. The increases and decreases in the asks were evenly split during the times I took a look. If the folks willing to hit the bid willy-nilly are near exhaustion, which we don't know, we might have a chance to hold, or even increase, VWAP for a day or two.
That won't do anything for the next share-issue price though.
On the bid side there were eight increases and only three decreases out of thirteen peeks. So we did have some bullish folks since increases can't come due to "uncovering" a better bid - these were folks willing to up the bid.
Regardless, VWAP continues to deteriorate, albeit very slowly: $0.1949, $0.2122, $0.1999, $0.1963 and $0.1961 today.
My original experimental inflection points have four periods showing increasing weakening and to with lessening weakening on the one-day changes - I'm reading them essentially flat. The five-day change has five showing reducing weakness and the average rate of change over five days has all six showing reducing rate weakening. We are not at the state where I would hazard that we are near seeing a trend of improvement though.
My newer version is a bit less optimistic with only two periods having one-day changes showing less weakening. The five-day changes have three suggesting reducing weakness and the average change rate over the five days has only one period suggesting such. ATM, no indications of a trend up are present.
Details of "Dly Sht % of 'sells'" and inflection points are in the latest daily post above.
06/18/2013: EOD stuff partially copied to the concentrator.
# Trds: 39, MinTrSz: 100, MaxTrSz: 25000, Vol 189360, AvTrSz: 4855
Min. Pr: 0.1920, Max Pr: 0.2000, VW Avg. Tr. Pr:0.1963
# Buys, Shares: 13 52417, VW Avg Buy Pr: 0.1984
# Sells, Shares: 17 113600, VW Avg Sell Pr: 0.1958
# Unkn, Shares: 9 23343, VW Avg Unk. Pr: 0.1939
Buy:Sell 1:2.17 (27.7% "buys"), DlyShts 65840 (34.77%), Dly Sht % of 'sells' 57.96%
6/18: 85% x avg. of 20 lowest intra-day VWAPs, $0.2266, in 40 days: $0.1926
A 2K AH trade is not included in the FINRA-reported volumes. Adding this to the days volume moves the volume from 187,360 to 189,360 and the short percentage from 35.14% to 34.77%. If the 2K is also added to daily short sales, the short volume moves from 65,840 to 67,840 and short percentage to 35.83%.
There's not much I want to say today - things are pretty-much status quo except for a narrowing price spread. Buy percentage continues to fall but is not yet in the exceptionally low range. If the trend doesn't reverse soon it will be exceptionally low. I suspect a couple possibilities account for what we are seeing ATM. One, of course, is that folks are looking at something similar to the 85% line above and are trying to bail with as little damage as possible because they have no faith that the news that is needed to support share price will appear in a timely fashion.
Another, and maybe more likely scenario(?), is that some portion of the "financiers" are acting even worse than the last round of them acted. This round has a no-lose situation for them whether price goes up, down or sideways. With the more active crop of market-makers, that generally were not present or very active prior to the financing nearing, now seen frequently at the top of the offers stack I suspect they are servicing the "financiers". Only occasionally have we seen much price discipline and patience from them. The one that seems most prominent near the top of the ask stack is ARCA, a major exchange.
The one-day changes in my original experimental inflection points are "flattish", with only two showing increasing weakness. This is more an effect of values falling off the tail of the measuring periods rather than any near-term change in behavior. The change over five days has only one weakening. The average change over five days is also "flattish", having only two showing rate of weakening increasing, likely from the same tail effects mentioned above.
My newer version has only one of the periods showing a one-day increase in weakening. This difference is due to consideration of some additional factors reducing the tail effect somewhat. Overall the one-day changes are also "flattish". The change over five days has all periods strengthening. With the "mini-pop" we had in buy percentage and the other factors a few days ago, this is not surprising and should not be given a lot of weight ATM. The average rate of change over the five days is exactly the same and should be discounted for the same reason. We are to evaluate these on their trends, not a single change.
Details of "Dly Sht % of 'sells'" and inflection points are in the latest daily post above.
06/17/2013: EOD stuff partially copied to the concentrator.
# Trds: 112, MinTrSz: 100, MaxTrSz: 15000, Vol 436047, AvTrSz: 3893
Min. Pr: 0.1951, Max Pr: 0.2120, VW Avg. Tr. Pr: 0.1999
# Buys, Shares: 43 149396, VW Avg Buy Pr: 0.2026
# Sells, Shares: 69 286651, VW Avg Sell Pr: 0.1984
# Unkn, Shares: 0 0, VW Avg Unk. Pr: 0.0000
Buy:Sell 1:1.92 (34.3% "buys"), DlyShts 141509 (32.45%), Dly Sht % of 'sells' 49.37%
06/17: 85% x avg. of 20 lowest intra-day VWAPs, $0.2292, in 40 days: $0.1948
Nothing remarkable today. Based on the 10 and 25-day average trade sizes, 4,251 and 4,390 it looks like our new retail range is, indeed moving a bit lower. Today it's at the lower part of mid-range I guess. The buy percentage is a bit lower than the longer-term averages, 42% and 39% for the 50 and 100-day averages respectively. But it's still in a normal range. Volume is above the 50 and 100-day averages, 385K and 293K, as the VWAP continues to deteriorate (yesterday was $0.2122).
One thing of note is that the fails to deliver data today shows what I expected and in subsequent comments in that thread I mention some possible causes. I'm leaning towards my TFH explanation as I can see no exceptional condition that would account for a "normal" delivery failure, as suggested in the SEC defense of these fails, to require a 10-day period to INCREMENTALLY close out the failed positions. For a fail with legitimate reasons, I think a single whack or two would've closed the fails. I'll have the related charts updated later. Note the paucity of fails-to-deliver that began to develop in the "Jan - Jun 2013" chart around 2/1/13. BTW, the charts are logarithmic.
Yesterday I said "If the VWAP improvement holds, I'll be surprised just on general principal. But the are some indications that it may hold". Not surprised yet in spite of the presence Friday of some things that said "maybe, just maybe". Oscillators remained oversold, ADX deteriorated, volume on our slip down today remained relatively high, suggesting we aren't bottomed out yet (if ever!), And our high, low and close were all lower along with the VWAP.
On my original inflection points, four of the six periods had weakening in the one-day change. Only the 5 and 50-day changes had improvement, with the 5-day showing substantial improvement while remaining a long way from positive. Changes over five days were split with the 5, 50 and 200-day improving whilst the rest weakened. The average rate of change over the five days supports what we see there.
My newer version had the pretty visual pattern somewhat ruined by today's weakness. Needless to say, the one-day change reflected today's behavior, with only the 5-day continuing to show improvement while the other five periods weakened. Five of the six periods showed improvement of five days, with only the 100-day showing a minimal weakening. The average rate of change over those five days shows improvement across the board. But we need to remember that all the current calculations are still well below zero and so I interpret these rate changes as only suggesting reducing rate of weakening, not increasing strength.
Details of "Dly Sht % of 'sells'" and inflection points are in the latest daily post above.
06/14/2013: EOD stuff partially copied to the concentrator.
# Trds: 169, MinTrSz: 100, MaxTrSz: 49800, Vol 742259, AvTrSz: 4392
Min. Pr: 0.1970, Max Pr: 0.2650, VW Avg. Tr. Pr: 0.2122
# Buys, Shares: 87 358787, VW Avg Buy Pr: 0.2160
# Sells, Shares: 80 380472, VW Avg Sell Pr: 0.2087
# Unkn, Shares: 2 3000, VW Avg Unk. Pr: 0.2070
Buy:Sell 1:1.06 (48.3% "buys"),DlyShts 310280 (41.80%), Dly Sht % of 'sells' 81.55%
85% x avg. of 20 lowest intra-day VWAPs, $0.2315, in 40 days: $0.1968
I've added a new line to my EOD summary. See the details of financing filing, "29. CERTAIN DEFINITIONS", item (k) "Company Conversion Price" on page 36, (ii) "Pre-Installment Conversion Price" detailed on page 43, and (xx) "VWAP" on page 45, all in the provided link, so that you can check my math. The VWAP determination may not match my calculations, although I would be surprised if it didn't.
Also keep in mind when you read the sections that these calculations can be overridden.
The following was not posted in the concentrator today.
The news of the order from ePower on Thursday apparently had a positive effect on the sentiment. Things moved so quickly this morning (Friday) that my minor lateness to the keyboard, which normally would not cause me to miss much, if any, action, put me way behind the curve. Early on it was a struggle to catch up. So ...
I wasn't able to track right from the open this morning, so when I did get to the keyboard and saw where prices were at, the first thought that crossed my mind is detailed in this comment. Essentially, I thought some bullish folks not worried about penny or two in price difference had put in "at the open" buy orders. Indelco corrected me, saying, in brief, it looked like bids chasing the ask up over time.
That prompted me, while writing this, to look at Time and Sales that shows bids, asks and trades. We see b/a of $0.193x5K/$0.197x15K at 9:30:00. By 9:30:42 ask was to $0.1998x10K and then $0.205 in the same second. Bid was unchanged as ask moved to $0.21x13.5K at 9:31:16. At 9:31:28 bid started stepping up to $0.205, by 9:35:29, while the ask retreated to $0.2099 during that period. With ask moving to $0.21 at 9:38:38, bid started moving from $0.205 to $0.2099 starting at 9:38:40 and bid and ask started moving up: ask $0.225 & bid $0.2249, ask $0.229 & bid $0.2289, ask $0.23, bid $0.2299, ... peaking at ask $0.265 & bid $0.2649 by 9:39:51, after which the bid fell back to $0.21 at 9:39:55. The sellers recognized the bid retreat and at 9:40:20 started retreating, first to $0.2649. The typical dance began with bids creeping up a bit as asks slipped down slowly - negotiation in the market. By 9:41:43, stability was beginning to appear and the asks started dropping a bit more rapidly as the bids began retreating a bit again. By 9:44 stability beginning with b/a of $0.21xx/$0.22 was achieved.
My take on this now is a possibility that there were some orders in on the buy side that the market-maker(s) could see, and we couldn't see because it wasn't presented in the market, that allowed for a higher buy price by the market-maker, who could chase a bit and still make some money on the arbitrage of buying low in the market and (possibly) selling higher to an in-house customer or via an inter-broker order. We likely wouldn't be able to see these last steps because they didn't put the orders out on the market.
My next take on this includes two distinct possibilities, and even a mix of the two. There was possibly some algorithm-driven computers involved in the chasing prices up. I suspect this because of the speed with which the bid and ask changed in some cases. However, an alternate possibility is that traders or investors, with a decidedly bullish view, from a variety of brokers started pounding in their orders in a determined effort to get some shares. Coming from a potentially large number of traders or investors at apparently random intervals in close temporal proximity would give the same appearance as some algorithm-driven computer(s) operating in the market.
For some context on this, see the second set of trades breakdown in time sequence below.
So, other than the EOD results above, what can we add to gauge which scenario seems most likely. Keep in mind that after this initial rush, we had more typical behavior, including some follow-on weakness, although not our typical "late-day weakness" seen when ATDF was the predominate market-maker controlling the trading we observed. Along with the downside the more active market-makers brought to us they may have brought some upside too, for whatever reason - competition I guess.
Following are breakdowns by price range and then by time blocks.
$0.1970-$0.1998: 057775 shares, 07.78% of vol, VWAP $0.1975, b:s 100%
$0.2001-$0.2040: 105722 shares, 14.24% of vol, VWAP $0.2019, b:s 1:14.10, 6.6% buys
$0.2050-$0.2099: 329337 shares, 44.37% of vol, VWAP $0.2071, b:s 1.12:1, 52.3% buys
$0.2100-$0.2145: 108600 shares, 14.63% of vol, VWAP $0.2106, b:s 1:1.79, 35.8% buys
$0.2150-$0.2150: 012300 shares, 01.66% of vol, VWAP $0.2150, b:s 1:1.56, 39.0% buys
$0.2200-$0.2249: 023225 shares, 03.13% of vol, VWAP $0.2211, b:s 2.10:1, 67.7% buys
$0.2250-$0.2300: 052500 shares, 07.07% of vol, VWAP $0.2287, b:s 1:3.20, 23.8% buys
$0.2310-$0.2650: 052800 shares, 07.11% of vol, VWAP $0.2631, b:s 16.60:1, 94.3% buys
09:30-09:57: 289800 shares, 39.04% of vol, VWAP $0.2208, 68.8% buys
10:03-10:58: 091837 shares, 12.37% of vol, VWAP $0.2077, 83.9% buys
11:03-11:59: 105877 shares, 14.26% of vol, VWAP $0.2047, 23.1% buys
12:01-12:55: 099000 shares, 13.34% of vol, VWAP $0.2074, 30.0% buys
13:02-13:52: 055000 shares, 07.41% of vol, VWAP $0.2098, 25.1% buys
14:01-14:55: 021345 shares, 02.88% of vol, VWAP $0.2049, 9.4% buys
15:04-15:16: 014000 shares, 01.89% of vol, VWAP $0.2071, 53.6% buys
15:31-15:58: 065400 shares, 08.81% of vol, VWAP $0.2054, 7.6% buys
On to the mundane ...
Average trade size seems to be settling in just below 5K as a trend. It might be too early to conclude this, but for now it's looking like what I think is mid-range of retail may have to be adjusted lower with the new set of market-makers participating. The 10, 25, 50 and 100-day averages are 4364, 4377, 5263 and 5032 respectively. Back around 4/22 they were 6745, 5903, 5277 and 5708, so you can see there has been a significant shift (appearing first in the shorter periods), for which we'll have to account if trying to derive meaning from this metric. BTW, the current levels are somewhat similar, on the shorter periods, to what was seen back in the mid-March time-frame when we were in a price downtrend. This is most clearly seen on my charts.
Regardless of (an apparent) selling bias recently, the buy:sell ratio seems generally to be trending toward stabilizing in more traditional ranges. If our recent price collapse was due to the financing deal, this may suggest that any of those financiers that were dumping into the market are either near done for now or have met a wall of buyers hollering "That's dirt cheap - I'll take them off your hands!". Maybe, just maybe, today's early action and then semi-typical weakening in price is a sold demonstration of that? Of course, the sellers could have been retail longs that got scared witless, literally IMO, by the fear of, or details of, the financing.
Relating to that, I'm gonna have my TFH antennae switched to high-gain mode as the first week of July rolls around, just to see if we get some kind of repeat performance. Related to that, I've added a rolling 40-day window that calculates the average of the lowest 20 VWAPS within that window.
The VWAP made a nice recovery today: $0.2363, $0.2176, $0.1961, $0.1942, $0.1949 and $0.2122 today. It was on "good" volume, in thousands: 781.18, 1330.46, 1311.85, 537.91, 433.08 and 742.26. If the VWAP improvement holds, I'll be surprised just on general principal. But the are some indications that it may hold.
The first is the increased volume on a day with a price move up. Our low and VWAP were the best since the $0.21 low and $0.2176 VWAP on 6/10, and our high was the best since 6/4's $0.2719. The range was excessive today - high volatility, which often is a precursor to a change in trend - let's hope it's not just "go flat".
Peeking at some traditional TA stuff, the second thing that instills some cautious optimism is the oscillators I watch. Several are in oversold territory, including the RSI, MFI, Williams %R and stochastic. Since we've had some volume return, I think we can give the oscillators a little more credence than we otherwise might. The ADX and related made a small bullish cross of the DI+ and DI-, but this is a "one-day wonder" ATM. If it continues to improve another day or two we can figure it's telling the truth. Combined with the oversold indications in several oscillators, I'm looking for the bottom to be in and at least some flattening, at worst, and some upside certainly possible.
This is the second consecutive day of higher lows and our close of $0.201 on 2.1K shares, although very near the bottom of today's range, was highest since 6/10's (there's that date again!) $0.212. Note there were only two trades at this price, the other being 10K at 10:47. In the 3.5 minutes prior to the last trade, two trades totaling 32.1K traded at $0.205-$0.206. Since 2.1K was a sell at $0.206 13 seconds earlier and the close was 2.1K at $0.201, there may be some connection between the two trades.
The MACD histogram, which had respond to our recent action with a big negative move, looks to have bottomed and started a slow painful crawl back up, but it won't be fast IMO.
I noticed a pattern that made it worthwhile to check Bulkowski's Gravestone Doji Candlestick discussion. He says "Many people look at a gravestone doji with alarm, especially during an uptrend. They believe that it signals a bearish reversal. It does, but only 51% of the time. I call that random. The trend after the reversal does not amount to much, placing the performance rank at 77 out of 103 candles where a rank of 1 represents a trend that really moves", and there's more of interest, notably "However, after an upward breakout in a bear market, price moves higher by 5.09% in 10 days, which is quite good. When you consider that price closed at the bottom of this candlestick, the climb is even higher (because I measure from a close above the top of the candlestick as the breakout, and do not start counting from the bottom of the doji). Using the height of the candle projected in the direction of the breakout shows that the trend meets the predicted target 79% of the time, which I consider acceptable".
Last, "Gravestone doji candles taller than the median show price that moves about 50% farther after the breakout than those shorter than the median". We qualify here! The height of this candlestick reached 85.7% of the height of the down-leg preceding it.
We need to keep in mind that he's talking exchange-listed stocks and the penny-stock we are involved with can be expected to be less in tune with his metrics.
My original inflection points are beginning to lose their suggestion of a reduction in the weakening. I told you they were "flaky". Four of the six periods are weaker and only the 5 and 50-day show a little improvement. The five-day change of the six periods has a three and three split, with increased weakness in the 5, 10 and 25-day periods and improvement in only the longer-term 50, 100 and 200-day periods. However, the average rate of change over five days for those periods has 5 of the six showing improvement. Only the 5-day shows deterioration. Since only volume and buy:sell are considered in the original calculation versions, this "flaky" behavior is the result as much from what happens at the tail of the period as at the head regarding volume and buy:sell.
My newer version is prettier to look at even if it turns out to be totally bogus! Visually, every period is moving up and the longer-term ones are doing so impressively. As with the original, activity at the tail of the period has influence, but changes were made which increase influence at the head without resorting to crudities ( ;-) ) such as exponential moving averages. Looking at the actual numbers, six periods all had very noticeable reductions in weakness - i.e. "strengthening". But while they are still so far from crossing zero, I prefer to think in terms of less weakness indicated. The five-day change of all was similar except that four periods actually went from "lessening weakness" to "strengthening". Only the 5 and 10-day periods were still "less weakening" in nature. The average rate of change over the five days supports that result in each period.
Looking for analogues to see what might be next, I checked the one-year-snapshot of the newer version near line 21, the closest match to what I see ATM. If the activity repeats, we'll see a modest rise in price that goes into a flat trading pattern. If the visual pattern should morph into something like what's near line 16, then a more substantial rise could be seen. There are some differences in configuration that make this assessment a bit shaky though - the spread between the periods and the width between the shoulders of the valley being the most marked. This may indicate that there's more strength awaiting us as it took longer to make the valley bottoms. I'll be looking to see if the pattern develops further to look more like what's around line 16 (just preceding the 11/14 grind-up beginning) - closely bunched around the zero-line and then all six periods showing reducing weakness and the following day VWAP moved up about a penny-and-a-half and one period shot way above the zero-line. This gave us about a week's advanced notice that moves up were likely.
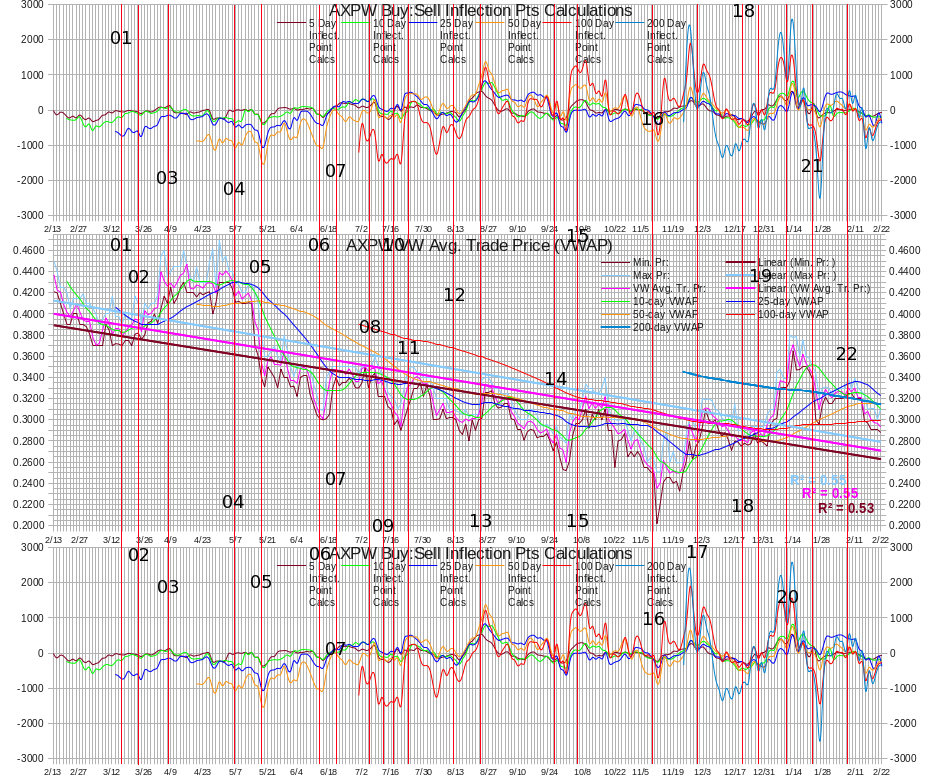
The start of another grind up would be nice, but I think unlikely, with the financing details known, unless Axion can start a somewhat steady stream of news with significance attached to it. An alternative might be some more laudatory articles about the company and its product(s) in widely-read publications.
Details of "Dly Sht % of 'sells'" and inflection points are in the latest daily post above.
06/13/2013: EOD stuff partially copied to the concentrator.
# Trds: 115, MinTrSz: 300, MaxTrSz: 20000, Vol 433078, AvTrSz: 3766
Min. Pr: 0.1902, Max Pr: 0.2000, VW Avg. Tr. Pr: 0.1949
# Buys, Shares: 63 227917, VW Avg Buy Pr: 0.1955
# Sells, Shares: 47 193161, VW Avg Sell Pr: 0.1941
# Unkn, Shares: 5 12000, VW Avg Unk. Pr: 0.1955
Buy:Sell 1.18:1 (52.6% "buys"), DlyShts 158507 (36.60%), Dly Sht % of 'sells' 82.06%
We had a pretty good day, for the most part as buying was relatively strong through ~13:20. I knew it couldn't remain that strong with our cadre of more active market-makers present, but we still end well, as we can see buy looking at recent buy percentages: 63.8%, 36.3%, 28.7%, 40.7%, 22.5% and 52.6% today. I don't know if it was because of the announced second order for batteries from ePower or just a natural response by investors seeing a good risk/reward at these price levels. It's not all coming up roses yet though - the sellers were still quite active and managed to keep price from moving back above $0.20. With volume continuing to fall (in thousands: 781.18, 1330.46, 1311.85, 537.91 and 433.08 today), I'm hopeful this is a sign that the cheap sellers, whoever they are, are getting near exhaustion.
We may have started the turn up even as the VWAP doesn't look all that impressive. Here's the low, high and VWAP for this five-day period. Note the beginning of a possible turn.
0.22010.25000.2363
0.21000.23490.2176
0.19000.21800.1961
0.19000.20000.1942
0.19020.20000.1949
With our sub-$0.20 prices causing "standard presents" to be in the 5K rather than 2.5K size, I don't think I can draw a lot of conclusions from average trade size regarding any possible trend.
The daily short sales continue to behave as it has since our cadre of more active MMs began affecting the action. Note the high percentage of "Dly Sht % of 'sells'" above. That's relatively high, which would normally concern me if it was part of a larger trend of higher percentages. We do not have such a trend and my take is that the comeback of buying allowed the sellers to hit the bid a little less, causing the reduced "sells" to cause the percentage of shorts to be higher, as evidenced by the fact that short volume, in thousands, was not out of line: 192.60, 131.80, 246.51, 309.20, 107.14 and 158.51 today. BTW, some unknown (larger?) portion of these volumes is likely attributable to just normal effects of more active MMs and not necessarily indicative of increased selling by traders or investors, IMO.
My original experimental inflection points are looking really "rasty" (rotten and nasty), in terms of absolute values (which aren't all that meaningful - it's the changes and trends that matter, IMO). So even though the absolute values are ugly, the fact that the one-day changes continues to split with three weakening (5, 25 and 200-day) and three improving (10, 50 and 100-day) would suggest things are holding steady ATM. The five-day change for these periods have four improving (5, 10, 25 and 100-day with big improvements in the 5 and 25-day periods and a "nice" improvement in the 100-day) and the average rate of change over the five days has four improving (nice move for the 5 and 25-day) and only two weakening a small amount. If this continues, we might see a formation begin to develop that suggest some price improvement, but I see this as a slow-developing scenario right now.
My newer version of the calculations, which was more pessimistic than the original early on, is now slightly more optimistic with the one-day changes having all six periods improving. The changes over five days for the periods have five of the six improving with only the 5-day not yet responding while the 100 and 200-day periods are showing a nice improvement. The average rate of change over the five days is in exactly the same configuration. If we weren't heading into a Friday, I'm might get all giddy with unwarranted optimism!
Details of "Dly Sht % of 'sells'" and inflection points are in the latest daily post above.
06/12/2013: EOD stuff partially copied to the concentrator.
# Trds: 112, MinTrSz: 357, MaxTrSz: 30000, Vol 537910, AvTrSz: 4803
Min. Pr: 0.1900, Max Pr: 0.2000, VW Avg. Tr. Pr: 0.1942
# Buys, Shares: 39 120907, VW Avg Buy Pr: 0.1968
# Sells, Shares: 62 377011, VW Avg Sell Pr: 0.1933
# Unkn, Shares: 11 39992, VW Avg Unk. Pr: 0.1952
Buy:Sell 1:3.12 (22.5% "buys"), DlyShts 107142 (19.92%), Dly Sht % of 'sells' 28.42%
Looking at the traditional TA-type charts, I don't see a quick rebound in the cards based on that. We've developed a cascade-down pattern that may have bottomed, in contrast to the two recent prior "spikes" down and immediate recovery. [opinion] This is no doubt an effect of the financing news and/or participants. Any recovery will likely be much slower until some *real* news comes out.
This round of financing sent arrows right into the heart of the *investors*.[/opinion]
A very unusual trade before the open ($0.20x2.5K) and one after the close ($0.1935x2.5K) do not appear on the FINRA data. Adding these to Finra's total volume would move it from 532,910 to 537,910 and reduce the short percentage from 20.11% to 19.92%. If we also add it to the day short sales, short volume moves from 107,142 to 112,142 and short percentage moves to 20.85%.
We had a choppy day in a very narrow range that started high ($0.20), dropped to the low of $0.19 by 09:50 and stayed pretty low (high of $0.193) through 13:09. By 13:25, up as high as $0.1999 but no follow-through on volume traded and we retreated to $0.191 by 15:42. we were fortunate to close at $0.1997 on a 10K trade at 15:59.
Having said that, I was glad to see the reduced volume (two prior days both ~1.3MM with only about a 29K difference) on a day that exhibited weak trading price action. Let's hope volume continues to taper of, at least briefly, so that we might conclude the selling rush is over. This is not supported by the buy:sell, yet, but that may be an indication that almost everyone that wants out (for now - next month might have a new bunch) is out.
Average trade size can't be measured in the same range as previously now because the "standard present" is now 5K, rather than 2.5K, in the range below $0.20. So today's average size is very small and not what I would call "retail". But there is some misleading behavior in the market. I noticed over the last few days many groupings of three trades that looked, due to things I've mentioned before, to be a single trade. A common sequence might be a buy or sell of 2.5K, one or more times, followed immediately by a trade(s) in the opposite direction. I think this might be MM action doing one side of their trade and then immediately offsetting the exposure by trading the opposite side. This masks the true size of the trades being serviced. This could also mean that we are seeing a volume closer to the 2:1 ratio of volume to orders that JP has mentioned in the past. How much closer I can't even guess.
The shorter-term buy:sell averages are weakening, but not yet in absurdly low ranges. If we do the normal vacillation, which includes some moves up, we should start to stabilize. This can only happen if the sellers' mindset moves to waiting for buyers to hit the ask, rather than sellers feeling the need to hit the bids hard. If our sellers are the "financiers", I don't look for this change. If they are mostly done for now at this price level, we have a chance to see it.
The daily short sale percentages have been trending lower since the end of May, but the real volume hasn't trended so steadily. In thousands, beginning 5/30: 49.70, 108.77, 95.00, , 30.50, 72.97, 192.60, 131.80, 246.51, 309.20 and 107.14. The percentage decline is generally a result of the increased trading volume.
Combining the short data with the thoughts about the average trade size, I think the *real* short *percentage* is also still very high. There's no way to support or counter this thought because we can't get even a ballpark (frank) estimate of the ratio of trades to (sell) orders and quantities. But my experience after watching for a long time makes me feel this is likely.
My original inflection point have all six periods with deteriorating one-day changes. Over five days, four of the six are weaker with only the 10 and 100-day values showing a small improvement. The average rate of change over the five days has two weaker (5 and 25-day), one essentially unchanged and the 10, 100 and 200-day showing good improvement. This is really a reduction in rate of weakening, at this point, rather than signs of strength.
My newer version is, right now, more positive. That's due to it considering additional factors (the "BangWhiz" variable? ;-) welcome back my friend - here's hoping you have great results and no stress this round). One-day changes had five of the six periods showing reducing weakness, with only the 10-day increasing weakness. The change over five days had the same configuration and the average rate of change over five days had improvement in five periods, *including* the 10-day, with only the 5-day showing a *very* small increase in the rate of weakening. For now, this jibes with my visceral assessment of what I see in the charts and the intra-day action. I know "visceral" doesn't count, but sometimes ...
Details of "Dly Sht % of 'sells'" and inflection points are in the latest daily post above.
06/11/2013: EOD stuff partially copied to the concentrator.
# Trds: 215, MinTrSz: 200, MaxTrSz: 50000, Vol 1311846, AvTrSz: 6102
Min. Pr: 0.1900, Max Pr: 0.2180, VW Avg. Tr. Pr: 0.1961
# Buys, Shares: 111 534056, VW Avg Buy Pr: 0.1965
# Sells, Shares: 96 755590, VW Avg Sell Pr: 0.1960
# Unkn, Shares: 8 22200, VW Avg Unk. Pr: 0.1933
Buy:Sell 1:1.41 (40.7% "buys"), DlyShts 309200 (23.57%), Dly Sht % of 'sells' 40.92%
Three AH trades at $0.20 of 8K, 8K and 2.5K are not included in FINRA daily short sales. Including that volume moves FINRA-reported daily volume from 1,293,346 to 1,311,846 and short percentage from 23.91% to 23.57%. If we also include them in the daily short sales, daily short sales go to 327,700 and short percentage moves to 24.98%.
Since the AH trades were at the closing price, I'm leaning towards them being just MM EOD balancing of their positions by (my best guess) filling a buy order for which they were accumulating throughout the day. With the more active MMs present, I think this is going to be fairly common as long as volume remains high and prices are at an area where folks might consider a buy low-risk.
I'm a bit surprised that we saw price hold as well as it did. On the mundane stuff, average trade size moved into the higher range of retail thanks to a higher number of 10K-25K trades. I guess lots of buyers are seeing the value proposition, vs. risk assumed, at these price levels. The buy:sell being so balanced supports this - sellers were not having to hit the bid to unload shares. Maybe some context will clarify this further. It's a bit fined-grained, due to the narrow spread, but nevertheless ...
$0.1900-$0.1910: 166500 shares, 12.69% of vol, VWAP $0.1906, b:s 1:32.30, 3.0% buys
$0.1911-$0.1949: 441293 shares, 33.64% of vol, VWAP $0.1936, b:s 1:1.68, 35.5% buys
$0.1950-$0.1970: 312753 shares, 23.84% of vol, VWAP $0.1954, b:s 1.36:1, 57.7% buys
$0.1979-$0.1999: 154200 shares, 11.75% of vol, VWAP $0.1983, b:s 24.70:1, 96.1% buys
$0.2000-$0.2050: 148100 shares, 11.29% of vol, VWAP $0.2005, b:s 1:3.56, 21.9% buys
$0.2100-$0.2100: 080600 shares, 06.14% of vol, VWAP $0.2100, b:s 1:7.86, 11.3% buys
$0.2101-$0.2180: 008400 shares, 00.64% of vol, VWAP $0.2117, b:s 1:2.50, 28.6% buys
On our last drop down, 4/29 (coincidentally when the daily short sales started to move up and remaining "high" to-date) we had a nice recovery over the next seven days: $0.2125, $0.2300, $0.2585, $0.2492, $0.2563, $0.2609, $0.2588 and $0.2513. Percentage-wise, mo-mo players would've found a 20%+ gain attractive, which likely explains some of the deterioration that followed.
I've added a couple trend lines to my price chart, using the VWAP as touch points. We are in a descending wedge that we need to break out of. If we do break to the upside, Bulkowski notes an average rise of 32%. Unfortunately, there's a price throwback 56% of the time, so if it does break out the results are not anywhere near certain.
My original inflection point calculations visually present a weakening pattern. The one-day changes have five of the six periods with increased weakness. The five-day change had a three-and-three split of strengthening and weakening. The average rate of change had four periods showing improvement - less average rate of weakening - and the three shortest periods, five, ten and 25--day, showing increasing average rate of strengthening.
My newer version, which seems to have been leading the original in earlier confirmation of a trend without being "flaky", has all six one-day changes and change over five days more negative. The five-day average rate of change has worsened in five of the six periods. Since this version is designed to be slightly less sensitive, it may be lagging detection but I wouldn't hang my hat on that because we know the original is flaky.
Details of "Dly Sht % of 'sells'" and inflection points are in the latest daily post above.
06/10/2013: EOD stuff partially copied to the concentrator.
# Trds: 256, MinTrSz: 100, MaxTrSz: 60000, Vol 1330464, AvTrSz: 5199
Min. Pr: 0.2100, Max Pr: 0.2349, VW Avg. Tr. Pr: 0.2176
# Buys, Shares: 108 382450, VW Avg Buy Pr: 0.2206
# Sells, Shares: 143 938714, VW Avg Sell Pr: 0.2165
# Unkn, Shares: 5 9300, VW Avg Unk. Pr: 0.2167
Buy:Sell 1:2.45 (28.7% "buys"), DlyShts 246507 (18.53%), Dly Sht % of 'sells' 26.26%
Had two AH trades, 10593 and 5K, totaling 15593, both at $0.21. Adding them to the volume moves the Finra-reported volume from 1314871 to what I show, 1330464, and the short percentage from the FINRA-based calculated 18.75% to my calculated 18.53%. If we also add it to the daily short sales, the short sales move to 262100 from the FINRA-reported 246507 and the short percentage moves to 19.70%.
With the volume and "buy;sell" ratio, I believe the financiers are still heavily in our market. So I'll only mention a few things.
Had some larger trades today that moved average trade size up to look like average retail as share price was hammered down by the sellers. Even so, the buy percentage managed to stay in a normal range. The averages are weakening though, so we don't want to see this continue (DOH!).
Shall I say we had a high-volume day? In fact in the four days from 6/5 onward, the day after effectiveness date of the share issuance related to the financing announced 5/8, we have traded 2,884,908 shares, an average of ~721K/day. On 6/4 our average daily volumes for 10, 25, 50 and 100-day periods were, in thousands, 251, 346, 303 and 281 respectively. Even excluding today, we averaged ~518.15K for the three days prior to today.
Regarding my original inflection points and the newer versions, more negative and even more move negative describe both. On my original every single metric but the five-day change, and their average rate of change, for the five, ten and one-hundred-day periods showed increased weakness. Those three showed strengthening or decreasing weakening. The newer version, in which I'm gaining increasing confidence, showed increased weakness on every metric, without exception.
Details of "Dly Sht % of 'sells'" and inflection points are in the latest daily post above.
06/07/2013: EOD stuff partially copied to the concentrator.
# Trds: 163, MinTrSz: 113, MaxTrSz: 29000, Vol 781176, AvTrSz: 4792
Min. Pr: 0.2201, Max Pr: 0.2500, VW Avg. Tr. Pr: 0.2363
# Buys, Shares: 62 283350, VW Avg Buy Pr: 0.2342
# Sells, Shares: 98 482826, VW Avg Sell Pr: 0.2377
# Unkn, Shares: 3 15000, VW Avg Unk. Pr: 0.2327
Buy:Sell 1:1.70 (36.3%), DlyShts 131800 (16.87%), Dly Sht % of 'sells' 27.30%
Little to say now that I realize we are still in exceptional times. If our new financiers are hammering into the market, nothing I can think of to look at is going to help determine good entry points or behavior going forward.
I'll still update my instablog.
Just a note that before we apparently knew how the new share holders from the financing round would behave, I had put up a chart, which I update daily, that was to help tell if another possible grind up was beginning. Although I think the chances are remote now, I'll keep it current until I'm positive. It has a blue and yellow rising support line that showed two possible channels that might be beginning. If we close below the yellow line again Monday, I think both channels are off the table and we'll need to be looking for other patterns to emerge.
Just to confirm what I think all of us already know, my original experimental inflection point calculations have all six periods weakening in the one-day change and all but the five-day weakening over five days. The average rate of change over the five days has all but the five and one-hundred-day weakening.
Recall that over the last several days I mentioned that my newer version was much more pessimistic? Well, the one-day change for five of the six periods are even more pessimistic than the original version - the weakening is of a larger magnitude, overall, and the ten-day has fallen below zero - the last to do so. The change over five days has all but the ten-day period weakening, along with their respective rates of change over the five days. The ten-day and its average rate of change are strengthening a small amount. But this only means, in conjunction with the one-day changes, that a value which dropped out of the ten-day's five-day change window was relatively much larger than the latest five-day calculated value and it is not, alone, indicative of a positive trend. This is exactly why I have multiple period calculations and look for a pattern of substantial agreement to call a signal.
In summary, the down move that was being suggested over many prior days is in full swing. The question is was this a few-days of the new shares from the financing round and, if so, how long will this cycle last and how low will it go. In the concentrator, there's talk that $0.22 is the floor, because of the terms of the financing deal ... until next month when more shares could be injected into those same hands again and again for a total of 12 months. And the price will depend on what happens in this market each month.
Details of "Dly Sht % of 'sells'" and inflection points are in the latest daily post above.
06/06/2013: EOD stuff partially copied to the concentrator.
# Trds: 159, MinTrSz: 100, MaxTrSz: 23000, Vol 554985, AvTrSz: 3490
Min. Pr: 0.2500. Max Pr: 0.2639, VW Avg. Tr. Pr: 0.2548
# Buys, Shares: 111 354332, VW Avg Buy Pr: 0.2560,
# Sells, Shares: 43 194558, VW Avg Sell Pr: 0.2526
# Unkn, Shares: 5 6095, VW Avg Unk. Pr: 0.2543
Buy:Sell 1.82:1 (63.8% "buys"), DlyShts 192595 (34.7%), Dly Sht % of 'sells' 98.99%
First things first. Someone is doing dastardly deeds, per my TFH. Every day now we have the last trade of the day hit the bid, either during hours or after hours. Today it was the low of the day and the only trade at that price. So, keep that in mind when looking at your technical tools and price action. In furtherance of context, here's a breakdown of the trading ranges.
$0.2500-$0.2500: 005000 shares, 00.90% of vol, VWAP $0.2500, b:s 0% "buys"
$0.2510-$0.2525: 159008 shares, 28.65% of vol, VWAP $0.2518, b:s 1:3.17, 24.0% buys
$0.2530-$0.2550: 223205 shares, 40.22% of vol, VWAP $0.2540, b:s 2.90:1, 72.3% buys
$0.2560-$0.2580: 059980 shares, 10.81% of vol, VWAP $0.2565, b:s 4.16:1, 80.6% buys
$0.2590-$0.2600: 081900 shares, 14.76% of vol, VWAP $0.2597, b:s 57.50:1, 98.3% buys
$0.2619-$0.2639: 025892 shares, 04.67% of vol, VWAP $0.2624, b:s 100% buys
Breaking it down by time-frame:
09:30-10:26: 026106 shares, 04.70% of vol, VWAP $0.2554, 23.7% buys
10:48-11:30: 075275 shares, 13.56% of vol, VWAP $0.2538, 53.2% buys
11:38-12:22: 110961 shares, 19.99% of vol, VWAP $0.2596, 87.6% buys
12:33-13:29: 139250 shares, 25.09% of vol, VWAP $0.2539, 69.2% buys
13:31-14:17: 072651 shares, 13.09% of vol, VWAP $0.2547, 50.2% buys
14:39-15:37: 093242 shares, 16.80% of vol, VWAP $0.2521, 48.8% buys
15:46-15:59: 037500 shares, 06.76% of vol, VWAP $0.2524, 86.7% buys
With that out of the way, recall that if we closed below $0.266 ... Well, "measure twice, cut once" is the rule and I didn't follow it. The real slope of the purple lines for the rising narrow trading channel was $0.0016/day, not the $0.0018/day I posted. That means today the price point that we wanted to hold was ~$0.2623. Didn't make a difference - we couldn't hold that one either. Even the high barely got past it.
Refer to my updated cleaned up chart for the following.
It looks as if we might be making a move towards a possible wider channel's rising support. Recall that I suggested this one (delimited with the blue lines) might come into play as I didn't believe the narrow channel (purple lines) would hold. That wider channel is still possible but today's low offers another possibility, which I've marked with an added rising yellow support line. ATM this new line may be a (more likely?) support as we have an origin and two touch points. The original blue line was an attempt to establish an early indication and as new information becomes available I try to incorporate it.
Because volume was rising, and "high", there several possibilities suggested.
The volume was high enough that the majority of sellers at this price may have been flushed out. Further, looking at the EOD buy:sell and the "buys" in the price breakdown above, we can see that buyers were willing to come in and hit the ask price on a large percentage of the day's trades. There's likely a few sellers that see the closing price and volume and get spooked and dump out, but hopefully very few and the buyers should come in and take those shares with little downside. In this case price may rebound and the newly-added potential support (yellow line) would seem to be in effect and the old potential support (blue line) would be discounted.
If there's more than just a few sellers left at this level and the buyers in this range were exhausted today, the price continues down on heavy, and likely rising, volume and that new potential support (yellow line) is not in effect.
We might move sideways and be unable to determine where support actually resides until a decisive directional change occurs.
One thing I don't want to see is the lows continuing to push on my experimental 13-period lower Bollinger. Recall from past discussions that we tend to do this for around six days, IIRC, if it gets started. That may have changed since the "big uglies" are gone, but we still have "mini-uglies", apparently, and don't know behavior in the current environment (new MMs too!).
We had some odd action today with someone sweeping up shares at the ask. See my comment here.
Average trade size was in the low range of what I believe is retail again, but I noticed something odd that makes me think the orders were much larger than they would appear. First, of course, is "proximity". Quite often several small trades occurred within a few seconds of each other, and even in the same second in several cases, at the same price and were all either "buys" or "sells". This is fairly common, but I've been loathe to try and judge that they are associated with the same order. There was also an odd sequence of trade sizes from 13:31-13:42, all buys except the last 100 shares, which was "unknown": six sets of 100 & 2500 shares, then 2600, 2500 and 100, 7600, 2600 and 100. I don't have any interpretation of this - it's just very unusual and strikes me as a sign a possible larger order was being processed.
Anyway, considering such above items and the volume I think the real average trade size was larger than what the numbers present.
Most things on my experimental instablog stuff continue as before: daily shorts staying in the "normal" range, buy:sell continues to move averages into normal ranges, price continues to weaken.
My original inflection point calculations remain in disarray as the volatility whips them around. The one-day changes have 4 of the six periods improving, showing less weakness. The five-day change of those have a three and three split with the 10, 25 and 50-day showing improvement and the others weakening. The average rate of change of those five-day periods has four improving and two weakening only slightly.
My newer version is a bit less optimistic on the one-day changes, having only three showing improvement and the weakening three being a bit larger in their moves lower. The five-day changes only have two showing improvement and the average rate of change of those five-day metrics have all six periods weakening.
Details of "Dly Sht % of 'sells'" and inflection points are in the latest daily post above.
06/05/2013: EOD stuff partially copied to the concentrator.
# Trds: 60, MinTrSz: 100, MaxTrSz: 11000, Vol 218283, AvTrSz: 3638
Min. Pr: 0.2530, Max Pr: 0.2601, VW Avg. Tr. Pr:0.2594
# Buys, Shares: 12 53418, VW Avg Buy Pr: 0.2600
# Sells, Shares: 48 164865, VW Avg Sell Pr: 0.2592
# Unkn, Shares: 0 0, VW Avg Unk. Pr: 0.0000
Buy:Sell 1:3.09 (24.5% "buys"), DlyShts 72968 (33.43%), Dly Sht % of 'sells' 44.26%
Referring to the cleaned up chart (updated) that I put up, yesterday I said "We might putter around this level a while or immediately move up or down. With a slope of +~$0.0018/day we need to see the close (and lows?) stay approximately at or above $0.2642, $0.266, ... as we go forward. If we don't, another consolidation, or even a re-trace lower, are possible. We still have a possible support from a possible medium-term rising channel (blue trend lines on the chart I linked) whose support has yet to be tested. It rises $0.00109/day and will be ~$0.2374 tomorrow, then ~$0.2384, then $0.2395, ...".
Today we closed at $0.2585, below the $0.2642 we needed to hold today for the rising channel delineated by the purple lines to remain in play. If we don't close at $0.266 or better Thursday, a break out of that channel will be confirmed. In that case ...
It looks like we would be going to do something I suggested 5/31 when I said, referring to the channel marked by the purple lines, "I've got a potential rising trading channel $0.0225 wide that rises $0.008/week. It's early yet and I'd like to see the support tested once more, but it does look promising. It's range through Friday was ~$0.256 - ~$0.2785. Being as tight as it is, it would be very easy to break out either way, so I wouldn't hang a lot of decisions on it. We need it to expand enough to actually make some legs up and down where we can see "waves" and this channel will not be that channel". This last sentence may describe what will happen.
If we close below the $0.266, which I seems likely, I think we move on down to the potential wider rising channel's untested support, marked by the blue line. Thursday and Friday this would be ~$0.2384 and $0.2395, respectively. With the volume higher on today's move down it's not unthinkable that we would hit that untested support line that quickly.
However, we did stop short of my experimental lower Bollinger at $0.2517. If that was a "close enough" bounce, we might see some recovery in price today. Just have to wait and see.
Average trades size moved back into the low end of what I believe is retail trading. Buy:sell remained reasonable, considering the downward price pressure with higher volume today. Daily short sales percentage continues in what I believe is a normal range. MACD weakened, as we would expect, but hasn't gone negative yet. Sans some improvement in the next day or two, I think it will go bearish on us.
My original experimental inflection point calculations have five of the six periods going more negative and only the 10-day is still positive. Five of the 5-day changes have deteriorated and the average rate of change had five periods weaken. My newer version, as with yesterday, is more bearish with all six periods having a negative one-day change and only the 10-day is still above zero. The five-day change and average changes over five days are all more negative.
Details of "Dly Sht % of 'sells'" and inflection points are in the latest daily post above.
06/04/2013: EOD stuff partially copied to the concentrator.
# Trds: 32, MinTrSz: 300, MaxTrSz: 10000, Vol 77889, AvTrSz: 2434
Min. Pr: 0.2605, Max Pr: 0.2719, VW Avg. Tr. Pr: 0.2665
# Buys, Shares: 10 28889, VW Avg Buy Pr: 0.2700
# Sells, Shares: 22 49000, VW Avg Sell Pr: 0.2645
# Unkn, Shares: 0 0, VW Avg Unk. Pr: 0.0000
Buy:Sell 1:1.70 (37.1% "buys"), DlyShts 30500 (39.16%), Dly Sht % of 'sells' 62.24%
I've been wondering if we might have started another "grind up". There's some similarities, but some differences too, notably the steepness of the move up and the concerns in our market existing this time. Last time we were working with some positives, including a belief that the "big uglies" were gone. This time, nothing so positive is in play - only finally getting the capital raise done and the hint that development of an arrangement with a tier-1 battery supplier, instituted by BMW, began several months back. I've slapped up a cleaned up chart that will let you see why I suspect this, as well as get a visual of some of the channel lines that I talk about.
On that chart, you can zoom in with both the usual click on the chart and, in Firefox at least, hit control and + to zoom in even further.
No AH trade today.
Yesterday I suggested that one of the expected moves might be a reversion to the mid-point of the Bollinger bands, ~$0.2627 yesterday. Today that would be $0.2642. The low, $0.2605 pushed past it but the VWAP was close enough. The nice thing about the low was that it was both small volume, only 5 trades for 6.5K shares, and it penetrated and bounced back (except for the closing trade, of course) above my rising near-term support, $0.2624 today, and the 50-day SMA, $0.2602. Since I felt that, for now, it would stay within my rising channel, this is good. It's important that the close, and I prefer the VWAP, continue to stay above this line to keep the up-trend intact.
For now, the very low volume (especially on those $0.2605 trades) and bias of the trades, shown below, suggests that we're just doing a leg down within the rising near-term channel (purple trend lines on the chart I linked). We might putter around this level a while or immediately move up or down. With a slope of +~$0.0018/day we need to see the close (and lows?) stay approximately at or above $0.2642, $0.266, ... as we go forward. If we don't, another consolidation, or even a re-trace lower, are possible. We still have a possible support from a possible medium-term rising channel (blue trend lines on the chart I linked) whose support has yet to be tested. It rises $0.00109/day and will be ~$0.2374 tomorrow, then ~$0.2384, then $0.2395, ...
Before I forget, our close would have been $0.2651 if not for one 1.5K trade at $0.2605 at 15:54:58. Must've been one of those I mentioned in a comment a while back - "sells too late"! ;-) Or if I let my TFH take control ... well, you know.
The bid/ask movements today were more neutral than in a lot of prior days: bids had five increases and five decreases while asks had six and six. I think this is reflected in the very narrow range and price and volume breakdown:
$0.2605-$0.2605: 006500 shares, 08.35% of vol, VWAP $0.2605, 100% "sells"
$0.2650-$0.2699: 052500 shares, 67.40% of vol, VWAP $0.2660, b:s 1:4.25, 19.0% buys
$0.2700-$0.2719: 018889 shares, 24.25% of vol, VWAP $0.2700, 100% "buys"
The sellers hit the bid pretty hard below $0.27. But with such low volume today, I don't know that we should assign much weight to that metric. Add in the very small average trade size and low volume and I think it's just the old uncertainty kicking in - "Let's wait and see what happens next".
The daily short sales continue the trend of settling around an area I expected to eventually appear. I believe this will be the "norm" as long as we have MMs such as ARCA, CSTI, LAMP, CDEL, ... more active in our market. If we see ATDF as the predominate MM again, I expect the short sales would reduce again.
As might be expected with today's action, my original experimental inflection points are weakening with four of the six periods, including the five and ten-day, weakening. The five-day change for those has a split of three and three and the rate of change over the five days has a similar split.
My newer version is more pessimistic with all six periods showing increased weakness along with the five-day changes. The rate of change over the five days has all but the longest period showing increased weakness.
I do want to emphasize that both versions are volume and buy:sell sensitive and changes under theses conditions should be not heavily considered in our thoughts.
Details of "Dly Sht % of 'sells'" and inflection points are in the latest daily post above.
06/03/2013: EOD stuff partially copied to the concentrator.
# Trds: 60, MinTrSz: 250, MaxTrSz: 30000, Vol 301541, AvTrSz: 5026
Min. Pr: 0.2700, Max Pr: 0.2775, VW Avg. Tr. Pr: 0.2748
# Buys, Shares: 18 136330, VW Avg Buy Pr: 0.2763
# Sells, Shares: 34 152661, VW Avg Sell Pr: 0.2737
# Unkn, Shares: 8 12550, VW Avg Unk. Pr: 0.2728
Buy:Sell 1:1.12 (45.2% "buys"), DlyShts 95000 (31.50%), Dly Sht % of 'sells' 62.23%
We had another AH trade below the close, $0.2726, again today - 5K at $0.27. The FINRA data excludes this 5K AH trade. Including it in the day's volume would move daily short percentage from 32.04% to 31.50%. Including it also in the daily short volume would move short volume from 95K to 100K and percentage from 32.04% to 33.16%.
Average trade size moved right into the middle of what I think is "retail" trading and is right at the calculated trend and just above the 25-day average. It has been trending back towards normal levels for over a week now. I think is a good sign that supports the other activity we're seeing. This includes the buy:sell returning to, and maintaining, "normal" levels (10, 25, 50 and 100-day average percentages are 53, 49, 41 and 41 respectively), VWAP price continuing to creep higher (5/20 forward $0.2575, $0.2594, $0.2598, $0.2644, $0.2646, $0.2593, $0.2628, $0.2713, $0.2709 and today $0.2748). We are above the four near-term averages of $0.2678, $0.2645, $0.2544 and $0.2586 for the 5, 10, 25 and 50-day averages respectively.
Volume is a bit anemic, but has been slowly trending higher since the last week of April.
The sellers were a bit less disciplined today. Of the 16 changes I caught, 11 were reductions in the ask and 4 were increases, some "uncovered". And they started reducing before 10:00 too. Meanwhile, the buyers increased the bids 7 times and decreased them 4 times, some "uncovered". In spite of that apparent imbalance, we had price trend higher through around 13:30 and weakness didn't appear until around 15:00, when we started to move down about a half penny by the time of the close. Regardless, we still had the VWAP improve, as you can note above.
On the traditional TA front, the MACD histogram flattened a bit but the signal and average are both now above zero and still trending up. The share price high is pushing right up against the short-term rising channel I mentioned yesterday and the low stayed above the mid-point of that channel. The 10 and 20-day averages are rising (currently $0.2664 and $0.2595 respectively) and we are above them and the 50-day ($0.2608). However, likely due to the low volume, all the oscillators I watch weakened a bit - nothing dramatic and all but the ADX and related are still at or above neutral. But with a bit higher volume and a slightly lower close ($0.2726 from yesterday's $0.2775) I expect they will weaken without a nice increase in volume and/or a price move.
We are near my experimental 13-period upper Bollinger ($0.2813) and a long way from the lower one ($0.2442). Traditional thought would say a move towards the mid-point might be expected. This would be ~$0.2627, which would be just fine as that's still above the rising short-term support of the narrow rising channel, ~$0.2565.
I don't see anything in the TA that suggests risk of a big drop here. ATM just a down leg within the trading channel seems like the most likely worst-case for now.
On my original experimental inflection point calculations, there's still no indication of a strong rise showing. The one-day changes in the six periods have only two showing minor improvement (the "bookend" 10 and 200-day ones) and the 10-day weakened noticeably. The 25, 50 and 100-day had only minor weakening. The change over five days had the same 2 and four configuration, as did the rate of change over the five days. So there's no clear indication of activity going forward there.
My newer version, considering additional factors, is more positive on today's action. The one-day changes were positive for all periods but the 10-day, which weakened only slightly. The five-day change for those periods had all but the 10 and 25-day improving and the average change over the five days had four improving. With the 5, 10 and 25-day calculations all above zero and the 200-day nearing that, the chance of much downside seems low ATM. Recall that the 25-day had recently joined the other two above zero and I don't look for a pullback unless we get a real reversal in the recent action.
But anything is possible with no news and sellers still obviously anxious to exit, if today's behavior is any indication.
Details of "Dly Sht % of 'sells'" and inflection points are in the latest daily post above.
Disclosure: I am long AXPW.OB.
Additional disclosure: I am very experimental, still learning TA and am not very conservative in my trading. But I am conservative regarding my confidence in what I'm learning and my attempts to share with others what I think I see coming. Your own DD is mandatory.