Now that we are several months into the PIPE effects, I see that my experimental stuff, which had normal markets in mind, is much less useful for now. I do believe the history of data and calculations may be useful in detecting when normalcy begins to return and also provide a template of possible effects of other PIPE financing deals for other folks down the road. So I'll keep capturing the data and updating the charts.
I'll also keep examining stuff but will chop my commentary down to minimal comments unless something really exceptional pops up.
To help keep the instablog shorter, I truncate some of the historical metrics, but keep enough here to hopefully keep the context clear and helpful.
Discussions related to the PIPE financing, and links, should be reviewed by those unfamiliar with them. To reduce load time and required scrolling, I've now eliminated them here as they've been up for a long time. Those can still be found in the header of AXPW: Intra-Day Trade & Buy:Sell Inflection Point Charting Beginning 10/1/2013.
A discussion of some daily short sales, and related, is also contained in that header.
I've been manually collecting this data for about 21 months now while volume was low and it was therefore reasonable to do so. I'll stop when it gets too arduous unless I can craft a mechanized capture of most of the stuff.
I've captured enough data now that I can reasonably expect to be able to detect patterns on the charts that may signal, somewhat reliably, when price moves are about to occur. To help more easily identify any useful patterns, I've made an instablog,
Axion Power International (AXPW) 2/13/2012 And Forward One Year Experimental Charts Snapshots. I've also added some lines to them that may assist in this. For anybody with an interest, I welcome any suggestions and/or help.I'll update this instablog daily as long as I can for anybody that might find it useful. The charts will stay near the top and the text updates detailing daily data and expressing my most recent thoughts will follow after the charts.
I've arranged the chart segments in this instablog to put what I think are related stuff close together.
This is the fifteenth installment of the original "AXPW: Some Intra-Day Trade Charting" instablogs I've started doing on Seeking Alpha. The others grew, as I added daily commentary and FINRA data, to the point I was afraid the load time might become an irritant for folks that have less internet bandwidth or older computing equipment so I've started rolling to a new one aperiodically.
Versions subsequent to the original (latest to oldest) can be found here.
AXPW: Intra-Day Trade & Buy:Sell Inflection Point Charting Beginning 10/1/2013
AXPW: Intra-Day Trade & Buy:Sell Inflection Point Charting Beginning 9/1/2013
AXPW: Intra-Day Trade & Buy:Sell Inflection Point Charting Beginning 8/1/2013
AXPW: Intra-Day Trade & Buy:Sell Inflection Point Charting Beginning 7/1/2013
AXPW: Intra-Day Trade & Buy:Sell Inflection Point Charting Beginning 6/1/2013
AXPW: Intra-Day Trade & Buy:Sell Inflection Point Charting Beginning 5/1/2013
AXPW: Intra-Day Trade & Buy:Sell Inflection Point Charting 3/1/2013
AXPW: Intra-Day Trade & Buy:Sell Inflection Point Charting 02/01/2013
AXPW: Intra-Day Trade & Buy:Sell Inflection Point Charting 12/15/2012
AXPW: Intra-Day Trade & Buy:Sell Inflection Point Charting 11/14/2012
AXPW: Intra-Day Trade & Buy:Sell Inflection Point Charting
AXPW: Intra-Day Trade Charting 9/6/2012 - Xx/xx/2012
AXPW: Intra-Day Trade Charting 7/7/2012 - 9/5/2012
In the below chart note that the volume is inverted to enhance readability! Be aware when you view it!
(right-click and open in new tab, position cursor over image to be able to zoom and scroll)

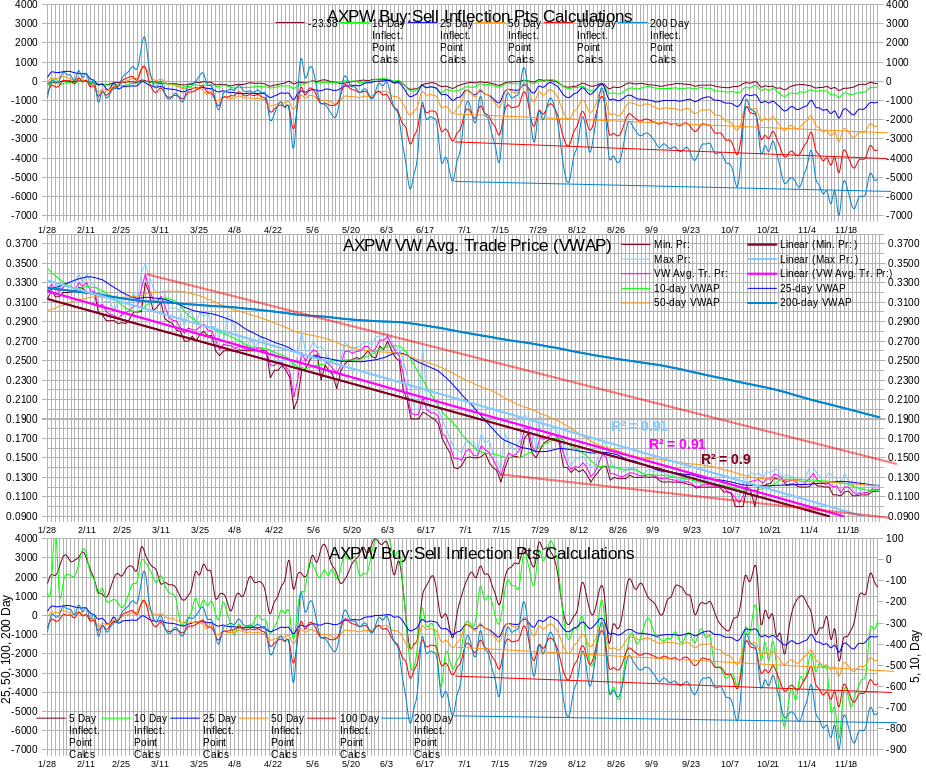
The following are modified inflection point calculations bracketing a price chart for comparison. Note that the false bullish moves and contrary moves of the 5-day has been eliminated.
The two inflection points are calculated identically but differently from the original above. I have two different presentations of this newer version. The top one has all periods on the same scale. The bottom one has longer periods on the left scale and shorter periods on the right scale. The hope is that shorter period changes will be easier to spot because of both the increased visual scale and the offset from the zero point of the long-term scale. More work to do, this is a start, hopefully.
I've identified some changes I want to try on the new inflection point calculations but haven't had time to implement them yet. I'll work them in over time after a little experimentation.
Comments and further suggestions welcome.
(right-click and open in new tab, position cursor over image to be able to zoom and scroll)
To reduce blog size, I've trimmed the oldest "2013 Dly Sht % of 'sells' values". Changes in the current set will be noticed and serve the same purpose. If needed, we can compare behavior to older stuff. Weekly 85% price summaries going back to 6/14/2012 have been also trimmed, along with some day-to-day VWAP changes stuff going back to 10/09. Older stuff for all three items is available in AXPW: Intra-Day Trade & Buy:Sell Inflection Point Charting Beginning 10/1/2013.
Continuing tracking the "Dly Sht % of 'sells'", inflection point calculations values, and end-of-week 85% PIPE price factors are now only in the latest daily comment - attempting to keep things shorter for faster loading.
11/29/2013: EOD stuff partially copied to the concentrator.
# Trds: 67, MinTrSz: 500, MaxTrSz: 49000, Vol: 405469, AvTrSz: 6052
Min. Pr: 0.1161, Max Pr: 0.1230, VW Avg. Tr. Pr: 0.1184
# Buys, Shares: 15 78269, VW Avg Buy Pr: 0.1197
# Sells, Shares: 52 327200, VW Avg Sell Pr: 0.1181
# Unkn, Shares: 0 0, VW Avg Unk. Pr: 0.0000
Buy:Sell 1:4.18 (19.3% "buys"), DlyShts 89269 (22.02%), Dly Sht % of 'sells' 27.28%
ABERRATION! FINRA-reported daily short sales trade volume is missing 195,700 shares of the daily trade volume. I've e-mailed FINRA for clarification - it could be a case of partial volume which will be rectified on the next business day. There could be unreported short sales included in the (apparently) missing volume. Regardless, adding that to the FINRA trade volume raises it from 209,769 to my total and would lower the short percentage from 42.56% to my 22.02%. If new data is received Monday, the day's record will be updated and this note may be removed.
Keep in mind that today trading ended at 13:00 so all the times and numbers are affected by this holiday-shortened trading. This might include such as price ranges and buy:sell ratios as well.
The average of the lowest 20 VWAPs times 85% today is $0.985 vs. $0.0986, $0.0987, $0.0988 and $0.0991 on prior days. 85% of today's VWAP is $0.1006 (YIPPEE! An up day!) vs. $0.0996, $0.1006, $0.0974 and $0.0972 on prior days. These are potential prices for the next tranche of shares to the PIPErs.
Today, VWAP, trade volume, and daily short sales moved +1.03%, -22.35% and +197.56% respectively. With this being a day after Thanksgiving and a short trading day, I don't know how much weight we should give these readings.
Regardless, I take comfort in the daily short sales volume and percentage (note the "ABERRATION!" above) behaving in the expected fashion (up and down in a general up trend from the absurd lows seen recently) in conjunction with the buy percentage being low. This confirms I'm getting a handle on the relationships even if I can never be sure why these behaviors apparently correlate well - just theories and deductions for the "why" of it all.
Yesterday I had concern with the buy percentage dropping to 10.5%. This was because all the buys occurred in the highest price range, $0.1199-$0.1219. It was ~10.5% of day's volume with ~90% of the day's trades being sellers stepping past the offers and directly hitting the bids. Maybe I worry too much, but this cycle of the daily short sales looks, within context of the longer term, as if we're heading towards the basement again with the longer-term trend having lower highs of daily short sales. If we get into a long period of very low daily short sale percentages VWAP can be expected to decline.
The pattern is clearly seen on the chart. Regardless of that concern, today both daily short sales ("ABERRATION!" again) and buy percentage bounced back some, continuing the expected short-term daily short sales pattern: 28.82%, 21.42%, 5.45%, 3.93%, 6.04%, 23.10%, 7.64%, 13.37%, 5.75% and 22.02% today.
No late-day weakness today - well, with a shortened trading day there was no "late-day" to weaken. See the trading breakdowns for a yawner.
The peeks at the asks today yielded four increases and seven decreases. The bid moves were fairly balanced - eight up vs. five down. Remember these are arbitrary peeks and not complete tracking.
Here's a trading breakdown by arbitrary time-frames.
09:33-09:38: 132500 shrs, 32.68% of vol, VWAP $0.1213, 24.9% buys
09:40-10:11: 056271 shrs, 13.88% of vol, VWAP $0.1168, 18.3% buys
10:16-12:33: 091298 shrs, 22.52% of vol, VWAP $0.1167, 14.3% buys
12:45-12:59: 125400 shrs, 30.93% of vol, VWAP $0.1172, 17.5% buys
Here's a breakdown by arbitrary price range.
$0.1161-$0.1166: 150700 shrs, 37.17% of vol, VWAP $0.1163, b:s , 0.0% buys
$0.1170-$0.1175: 092269 shrs, 22.76% of vol, VWAP $0.1171, b:s 1:5.04, 16.5% buys
$0.1190-$0.1199: 051000 shrs, 12.58% of vol, VWAP $0.1196, b:s 50.00:1, 98.0% buys
$0.1200-$0.1230: 111500 shrs, 27.50% of vol, VWAP $0.1216, b:s 1:7.58, 11.7% buys
On the traditional TA front we are still predominately trading below the 50-day SMA, now down at $0.1203. Since 11/18 our trading has been like this. See today's trading breakdowns. But I have a new worry (What?! I don't have enough already?!).
I have a long-term descending resistance constructed atop the highs (with some small "overshoot" 5/31 and 6/1. Origin is 5/5 with touches 5/31 and 6/1 (two consecutive days), 6/14, 11/15 and now today, 11/29. Note this last is approximate as the resolution of both the construction and reading is imprecise. Anyway, it looks like that resistance was $0.1236 today and our high was $0.123. We can hope this won't offer much resistance but the 6/14 and 11/15 touches had appreciable volume. Since these are the most recent I think it suggests the resistance could be strong. If today were a full trading day maybe today's volume would have been strong enough to also suggest strong resistance though.
As if we needed some more negative bias to come into play.
Our low rose slightly today from $0.1155 to $0.1161, as did the high going from $0.1219 to $0.123. The close moved from $0.116 to $0.117. With the shortened trading day preventing adding volume assessment into the mix I'm loathe to get excited about some small continued bullish price moves, especially with the daily short sales behavior, the continued trading mostly below the 50-day SMA, the long-term descending resistance, ...
The oscillators I watch are showing mostly slowly improving behavior. RSI and stochastic are just below neutral (~47.9 and ~45.7 respectively) and momentum is slightly positive (~1.04). Accumulation and distribution is a continuing concern. It is still weakening. Williams %R, ADX and related, and MFI continue to move in a positive fashion, but are below neutral.
On my experimental stuff, I'm most concerned with the continuing deterioration in the average trade size. It's below all averages and, more importantly, the 10, 25 and 50-day averages (yesterday 8561, 8863 and 8510 respectively) continued down to 8127, 8809 and 8461 today. But we had a short trading day - any effect? Regardless, this is more visible on the chart where the average trade size has also been below a short-term rising trend four straight days now.
In the past this has generally foretold weaker prices. I should hasten to add though that I am being likely premature here - I think the longer-term rising trend is really going to be the important point. So let's look at this for now as just suggesting less likelihood of a sustained price rise in the near-term.
Another point of ... disgust actually, is the buy percentage averages. All I'll say is take a look at the chart and note both the averages and trend lines. If you imagine that chart inverted, you see a rising "sell" percentage for a very long time now - since the month after the PIPE financing announcement.
My original inflection point calculations continue to suggest, at best, reducing weakening. This is an effect of the essentially flat trading behavior, leading to three periods showing slight improvement and three showing slight weakening. My newer calculations and charts, sensitive to additional factors, have all periods but the five-day in agreement - slight improvement. The five-day period shows noticeable weakening.
OTC markets down 11/07 until ~15:00 resulting in an aberrant day! Keep that in mind when looking at numbers below! Also, 11/27-11/29 was affected by Thanksgiving holiday - no trading 11/28 and 1/2-day 11/29.
Some day-to-day VWAP changes, with the end date shown and the percentage change from the prior day. Buy percentage is the last value on each line.
10/24 $0.1285 -02.80% 25.1%
10/25 $0.1254 -02.37% 27.8%
10/28 $0.1267 +01.00% 36.0%
10/29 $0.1274 +00.54% 55.6%
10/30 $0.1232 -03.25% 23.3%
10/31 $0.1222 -00.84% 21.2%
11/01 $0.1249 +02.20% 19.9%
11/04 $0.1289 +03.25% 33.5%
11/05 $0.1340 +03.94% 33.2%
11/06 $0.1272 -05.07% 24.3%
11/07 $0.1251 -01.68% 55.2%
11/08 $0.1229 -01.74% 38.9%
11/11 $0.1237 +00.62% 35.7%
11/12 $0.1201 -02.91% 28.3%
11/13 $0.1214 +01.07% 35.0%
11/14 $0.1139 -06.19% 31.7%
11/15 $0.1203 +05.69% 38.5%
11/18 $0.1206 +00.27% 43.5% MAN. ADJ'D. DATASET
11/19 $0.1155 -03.73% 23.6%
11/20 $0.1125 -02.57% 34.4%
11/21 $0.1136 +00.99% 47.2%
11/22 $0.1144 +00.66% 14.9%
11/25 $0.1145 +00.14% 34.9%
11/26 $0.1183 +03.28% 47.3%
11/27 $0.1172 -00.96% 10.5%
11/29 $0.1184 +01.03% 19.3%
This week's daily estimated values (older dailys in prior EOD posts in prior instablog) for next share issue:
11/25: 20 lowest intra-day VWAPs in 40 days avg, $0.1162, x 85%: $0.0988
11/26: 20 lowest intra-day VWAPs in 40 days avg, $0.1161, x 85%: $0.0987
11/27: 20 lowest intra-day VWAPs in 40 days avg, $0.1160, x 85%: $0.0986
11/29: 20 lowest intra-day VWAPs in 40 days avg, $0.1159, x 85%: $0.0985
Vol, in K, for above days: 776.50, 796.76, 522.19, 405.47.
Week ending summaries of PIPE financing estimated 85% share pricing, "Dly Sht % of 'sells'", and inflection points here are omitted from the concentrator.
Week ending values related to the PIPE 85% share pricing:
09/20: 20 lowest intra-day VWAPs in 40 days avg, $0.1301, x 85%: $0.1105 VWAP $0.1256
09/27: 20 lowest intra-day VWAPs in 40 days avg, $0.1273, x 85%: $0.1082 VWAP $0.1227
10/04: 20 lowest intra-day VWAPs in 40 days avg, $0.1243, x 85%: $0.1056 VWAP $0.1155
10/11: 20 lowest intra-day VWAPs in 40 days avg, $0.1200, x 85%: $0.1020 VWAP $0.1246
10/18: 20 lowest intra-day VWAPs in 40 days avg, $0.1198, x 85%: $0.1018 VWAP $0.1286
10/25: 20 lowest intra-day VWAPs in 40 days avg, $0.1198, x 85%: $0.1018 VWAP $0.1254
11/01: 20 lowest intra-day VWAPs in 40 days avg, $0.1195, x 85%: $0.1015 VWAP $0.1249
11/08: 20 lowest intra-day VWAPs in 40 days avg, $0.1193, x 85%: $0.1014 VWAP $0.1229
11/15: 20 lowest intra-day VWAPs in 40 days avg, $0.1183, x 85%: $0.1006 VWAP $0.1203
11/22: 20 lowest intra-day VWAPs in 40 days avg, $0.1166, x 85%: $0.0991 VWAP $0.1144
Vol, in thousands, for above weeks: 2,929, 3,439, 4,406, 6,963, 13,769, 9,640, 3,519, 6,816, 9,769 and 3,977
The 10/11 week was affected by PR of an Axion/NSC presentation at a conference. The effect carried over into the week ending 10/18 with ~2.89MM shares traded that Monday, 10/14. The week ended 10/18 had ~13.8MM shares traded.
On my ORIGINAL inflection point calculations, readings for 5, 10, 25, 50, 100 and 200 day periods:
---- 1-day change ----
11/19 +15.6% -04.8% -02.9% -01.1% -02.0% -01.9%
11/20 +17.3% +10.8% +00.7% +00.8% -00.3% -00.4%
11/21 +32.8% +00.1% +08.7% +01.1% +00.5% +00.0%
11/22 +09.8% +03.2% -02.1% -01.3% -00.5% -00.9%
11/25 -02.2% +02.7% +04.6% +00.1% -00.4% -00.4%
11/26 +49.4% +25.8% +05.2% +00.4% -00.5% +00.3%
11/27 -34.2% +06.7% +03.5% -00.4% -00.6% -00.7%
11/29 -32.5% +13.5% +02.3% +00.3% -00.6% -00.4%
---- 5-day change ----
11/19 +105.5% +083.1% +020.3% +037.9% +011.7% +017.9%
11/20 +523.2% +413.5% +038.4% +070.6% +025.2% +016.3%
11/21 +355.9% +050.1% +269.0% +238.4% +039.9% +031.9%
11/22 +007.4% -007.4% -009.0% -076.7% -014.9% +003.2%
11/25 -009.4% -032.0% +014.7% -157.2% +012.7% +005.4%
11/26 +010.1% +226.6% +085.1% +571.4% +054.2% +059.6%
11/27 -035.3% -017.6% +013.4% -101.5% -026.5% -016.2%
11/29 -080.1% +024.7% -036.4% -4394.3% -066.7% -27.8%
---- 5-day rate of change ----
11/19 +131.1% +135.4% +076.9% +207.2% +073.1% +091.8%
11/20 -056.5% +181.2% +094.8% +141.3% +165.2% +237.3%
11/21 +01719% +065.3% +11899% +086.3% +693.2% +897.3%
11/22 +012.8% -007.7% -000.2% -024.9% -029.2% +011.2%
11/25 -002.5% -032.5% -013.6% -021.6% +046.3% -003.3%
11/26 -035.6% +020.4% +028.6% -019.3% +016.5% +013.3%
11/27 -054.3% -054.6% -003.8% -076.9% -038.7% -025.0%
11/29 -282.1% +008.3% -085.9% -297.8% -097.1% -056.6%
On my NEWER inflection point calculations, for those same periods:
---- 1-day change ----
11/19 +007.80% -013.47% -013.28% -011.10% -013.55% -014.21%
11/20 +014.00% +006.46% -003.81% -004.39% -006.22% -006.71%
11/21 +036.25% +007.26% +014.77% +008.06% +008.23% +008.24%
11/22 +014.24% +006.17% +000.42% +001.00% +002.02% +001.64%
11/25 +002.28% +006.50% +008.15% +003.73% +003.79% +004.10%
11/26 +057.84% +036.60% +017.00% +013.48% +014.27% +016.49%
11/27 -049.88% +001.50% -000.42% -005.62% -006.40% -006.46%
11/29 -034.17% +013.46% +003.36% +001.13% +000.37% +000.88%
---- 5-day change ----
11/19 +143.95% +128.52% +035.89% -021.16% -055.20% -050.50%
11/20 -005.05% +107.44% -1001.77% -595.96% -593.01% -725.64%
11/21 +652.47% +370.79% +352.31% +287.35% +215.80% +199.14%
11/22 -022.05% -057.18% -086.78% -121.93% -152.11% -161.89%
11/25 -007.66% -019.76% +107.62% +060.65% +050.10% +046.26%
11/26 +028.98% +330.57% +346.40% +1523.74% +654.47% +574.55%
11/27 -029.35% -011.09% +010.74% -000.27% +005.55% +007.57%
11/29 -072.14% -000.85% -035.95% -035.89% -037.66% -032.82%
---- 5-day rate of change ----
11/19 +544.29% +513.59% +160.41% +070.04% +053.78% +064.24%
11/20 -090.58% -024.27% -093.76% -087.92% -105.64% -105.42%
11/21 +2846.3% +166.91% +2101.7% +800.90% +1640.4% +1681.5%
11/22 -033.49% -056.36% -092.60% -115.75% -146.89% -140.31%
11/25 +002.33% -034.48% +049.12% +043.85% +044.66% +040.60%
11/26 -024.06% +095.98% +387.88% +603.13% +294.56% +315.27%
11/27 -033.66% -019.90% +048.41% +056.92% +088.32% +090.99%
11/29 -256.26% -072.42% -107.48% -112.19% -102.15% -094.81%
Rolling 5-day ORIGINAL inflection point calculation aggregate change:
******* ******* *5 Day** *10 Day * * 25Day ** 50 Day **100Day* 200 Day
11/19 5 Day +0063.23 -0205.33 -0983.43 -1012.00 -1760.21 -2566.84
11/20 5 Day +0394.05 +0643.71 -0605.45 -0297.30 -1316.47 -2148.74
11/21 5 Day +1796.51 +0966.07 +1022.93 +0411.53 -0791.84 -1463.46
11/22 5 Day +1929.43 +0894.90 +0931.06 +0095.78 -0909.94 -1416.44
11/25 5 Day +1748.77 +0608.73 +1068.07 -0054.77 -0794.04 -1340.00
11/26 5 Day +1925.02 +1988.25 +1976.83 +0258.17 -0363.97 -0541.67
11/27 5 Day +1244.97 +1639.01 +2241.60 -0003.77 -0460.29 -0629.28
11/29 5 Day +0247.40 +2043.91 +1424.81 -0169.21 -0767.09 -0804.35
Average change/day, 5 days
____ **5 Day *10 Day *25 Day *50 Day 100 Day 200 Day
11/19 +066.36 +125.78 -086.18 +118.97 -044.73 -024.26
11/20 +028.88 +353.77 -004.52 +287.11 +029.17 +033.31
11/21 +525.39 +584.82 +533.66 +535.02 +231.42 +332.20
11/22 +592.79 +539.76 +532.80 +401.78 +163.82 +369.46
11/25 +577.76 +364.37 +460.55 +314.88 +239.70 +357.41
11/26 +372.36 +438.72 +592.05 +254.03 +279.25 +405.03
11/27 +170.18 +199.06 +569.41 +058.71 +171.24 +303.89
11/29 -309.82 +215.57 +080.38 -116.15 +004.95 +131.82
Rolling 5-day NEWER inflection point calculation aggregate change:
******* ******* *5 Day** *10 Day * * 25Day ** 50 Day **100Day* 200 Day
11/19 5 Day +0040.96 +0024.85 +0019.61 +0051.13 +0109.67 +0145.23
11/20 5 Day +0038.89 +0051.54 -0176.88 -0253.59 -0540.66 -0908.64
11/21 5 Day +0292.63 +0242.66 +0446.28 +0475.10 +0626.11 +0900.81
11/22 5 Day +0228.10 +0103.91 +0058.99 -0104.19 -0326.28 -0557.52
11/25 5 Day +0210.62 +0083.38 +0122.47 -0041.00 -0162.81 -0299.60
11/26 5 Day +0271.67 +0358.99 +0546.72 +0583.70 +0902.73 +1421.74
11/27 5 Day +0191.94 +0319.18 +0605.41 +0582.11 +0952.82 +1529.30
11/29 5 Day +0053.47 +0316.48 +0387.74 +0373.20 +0594.02 +1027.42
Average change/day, 5 days
____ **5 Day *10 Day *25 Day *50 Day 100 Day 200 Day
11/19 +0032.15 +0059.00 +0142.58 +0220.03 +0361.87 +0577.55
11/20 +0003.03 +0044.68 +0008.89 +0026.58 -0020.40 -0031.32
11/21 +0089.27 +0119.26 +0195.78 +0239.44 +0314.21 +0495.27
11/22 +0059.38 +0052.05 +0014.49 -0037.70 -0147.32 -0199.67
11/25 +0060.76 +0034.10 +0021.61 -0021.17 -0081.52 -0118.59
11/26 +0046.14 +0066.83 +0105.42 +0106.51 +0158.61 +0255.30
11/25 +0030.61 +0053.53 +0156.46 +0167.14 +0298.70 +0487.59
11/29 -0047.83 +0014.76 -0011.71 -0020.38 -0006.42 +0025.32
2013 Dly Sht % of 'sells' values JIC it turns out to be useful...
============ 2013 ===============
Tue. 09/03: 9.29% 34.87% 3.29% 6.14%
Mon. 09/09: 16.71% 16.28% 26.78% 37.54% 20.75%
Mon. 09/16: 13.75% 19.05% 6.49% 13.42% 0.00%
Mon. 09/23: 13.81% 8.28% 30.17% 16.94% 8.34%
Mon. 09:30: 24.17% 6.41% 6.91% 17.84% 19.68%
Mon. 10/07: 17.11% 8.60% 5.98% 61.69% 53.13%
Mon. 10/14: 45.42% 62.53% 67.90% 30.41% 73.99%
Mon. 10/21: 48.19% 47.09% 32.37% 38.06% 32.08%
Mon. 10/28: 37.81% 82.02% 21.45% 10.13% 7.45%
Mon. 11/04: 29.83% 49.63% 31.37% 45.17% 50.60%
Mon. 11/11: 27.53% 35.80% 45.77% 33.82% 46.96%
Mon. 11/18: 37.39% 7.21% 5.99% 14.59% 27.14%
Mon. 11/25: 12.23% 25.80% 6.42% 27.28%
============ 2013 ===============
Jan Avg: 44.20%, min: 00.00%, max: 262.58%
Feb Avg: 20.90%, min: 02.88%, max: 055.65%
Mar Avg: 15.42%, min: 00.00%, max: 100.79%
Apr Avg: 40.63%, min: 00.00%, max: 690.95%
May Avg: 67.58%, min: 09.15%, max: 150.50%
Jun Avg: 47.48%, min: 15.07%, max: 098.99%
Jul Avg: 44.47%, min: 11.23%, max: 122.28%
Aug Avg: 30.24%, min: 02.56%, max: 086.11%
Sep Avg: 16.30%, min: 00.00%, max: 037.54%
Oct Avg: 35.95%, min: 05.98%, max: 082.02%
Nov Avg: 28.42%, min: 05.99%, max: 050.60%
1129 Vol 0209769, Sht 0089269 42.56% LHC 0.1161 0.1230 0.1170 b:s 1:4.18[98]
1127 Vol 0522193, Sht 0030000 05.75% LHC 0.1155 0.1219 0.1160 b:s 1:8.50
1126 Vol 0796756, Sht 0106540 13.37% LHC 0.1155 0.1200 0.1170 b:s 1:1.10
1125 Vol 0776502, Sht 0059362 07.64% LHC 0.1120 0.1200 0.1150 b:s 1:1.79
1122 Vol 0406110, Sht 0093800 23.10% LHC 0.1120 0.1198 0.1140 b:s 1:5.71
1121 Vol 0281320, Sht 0017000 06.04% LHC 0.1120 0.1150 0.1139 b:s 1.38:1
1120 Vol 0582923, Sht 0022932 03.93% LHC 0.1111 0.1140 0.1120 b:s 1:1.91
1119 Vol 1332681, Sht 0072610 05.45% LHC 0.1111 0.1239 0.1115 b:s 1:3.20
1118 Vol 1373735, Sht 0294250 21.42% LHC 0.1160 0.1250 0.1200 b:s 1:1.31
1115 Vol 1853919, Sht 0538550 29.05% LHC 0.1150 0.1350 0.1151 b:s 1:1.59[97]
1114 Vol 1827868, Sht 0419031 22.92% LHC 0.1110 0.1225 0.1130 b:s 1:2.14
1113 Vol 2142796, Sht 0632986 29.54% LHC 0.1120 0.1279 0.1220 b:s 1:1.84
1112 Vol 2709292, Sht 0695002 25.65% LHC 0.1120 0.1310 0.1126 b:s 1:2.53
1111 Vol 1219966, Sht 0213133 17.47% LHC 0.1203 0.1350 0.1230 b:s 1:1.78
1108 Vol 1993612, Sht 0613441 30.77% LHC 0.1200 0.1300 0.1230 b:s 1:1.56
.... OTC markets down 11/07 until ~15:00 resulting in an aberrant day!
1107 Vol 0369750, Sht 0074900 20.26% LHC 0.1210 0.1300 0.1261 b:s 1.23:1
1106 Vol 1471255, Sht 0347896 23.65% LHC 0.1210 0.1335 0.1220 b:s 1:3.10
1105 Vol 1287910, Sht 0443810 34.46% LHC 0.1252 0.1399 0.1329 b:s 1:2.02[96]
1104 Vol 1643903, Sht 0342362 20.83% LHC 0.1203 0.1400 0.1350 b:s 1:2.08
1101 Vol 1124204, Sht 0065000 05.78% LHC 0.1200 0.1298 0.1220 b:s 1:3.90
1031 Vol 0608756, Sht 0047977 07.88% LHC 0.1200 0.1300 0.1201 b:s 1:3.65[95]
1030 Vol 0673218, Sht 0109287 16.23% LHC 0.1205 0.1251 0.1211 b:s 1:3.25
1029 Vol 0542552, Sht 0184438 33.99% LHC 0.1233 0.1300 0.1250 b:s 1.34:1
1028 Vol 0564849, Sht 0136699 24.20% LHC 0.1230 0.1315 0.1251 b:s 1:1.78
1025 Vol 1175537, Sht 0266692 22.69% LHC 0.1220 0.1329 0.1231 b:s 1:2.54
1024 Vol 0980046, Sht 0277600 28.33% LHC 0.1280 0.1300 0.1290 b:s 1:2.91
1023 Vol 2093489, Sht 0459040 21.93% LHC 0.1280 0.1375 0.1285 b:s 1:2.16[94]
1022 Vol 2873365, Sht 0825575 28.73% LHC 0.1295 0.1385 0.1352 b:s 1:1.52[92]
1021 Vol 2444176, Sht 0760929 31.13% LHC 0.1237 0.1348 0.1275 b:s 1:1.86
1018 Vol 1476191, Sht 0553173 37.47% LHC 0.1230 0.1360 0.1241 b:s 1:1.07
1017 Vol 3092833, Sht 0616357 19.93% LHC 0.1200 0.1299 0.1218 b:s 1:1.98[92]
1016 Vol 2978470, Sht 1063555 35.71% LHC 0.1222 0.1349 0.1290 b:s 1:1.21[91]
1015 Vol 4122321, Sht 1390478 33.73% LHC 0.1000 0.1320 0.1270 b:s 1:1.18
1014 Vol 2083880, Sht 0601501 28.86% LHC 0.1150 0.1350 0.1151 b:s 1:1.75[90]
1011 Vol 2317847, Sht 0681882 29.42% LHC 0.1200 0.1300 0.1200 b:s 1:1.28
1010 Vol 2649600, Sht 0838193 31.63% LHC 0.1000 0.1260 0.1153 b:s 1:1.06[89]
1009 Vol 0505800, Sht 0025310 05.00% LHC 0.1002 0.1075 0.1031 b:s 1:5.12
1008 Vol 0927512, Sht 0064165 06.92% LHC 0.1000 0.1193 0.1079 b:s 1:4.36
1007 Vol 0557660, Sht 0166600 11.94% LHC 0.1130 0.1173 0.1131 b:s 1:2.31
1004 Vol 0643987, Sht 0100787 15.65% LHC 0.1150 0.1175 0.1151 b:s 1:3.89
1003 Vol 1238821, Sht 0149800 12.09% LHC 0.1150 0.1217 0.1151 b:s 1:2.11
1002 Vol 0619474, Sht 0038312 06.18% LHC 0.1200 0.1205 0.1200 b:s 1:8.58
1001 Vol 1307672, Sht 0075394 05.77% LHC 0.1200 0.1228 0.1200 b:s 1:8.33[88]
0930 Vol 0585803, Sht 0097900 16.71% LHC 0.1200 0.1270 0.1220 b:s 1:2.24
0927 Vol 0428346, Sht 0031800 07.42% LHC 0.1200 0.1260 0.1201 b:s 1:8.11
0925 Vol 0535930, Sht 0092500 17.26% LHC 0.1200 0.1250 0.1211 b:s 1:1.64
0924 Vol 1314622, Sht 0084490 06.43% LHC 0.1190 0.1235 0.1200 b:s 1:3.46
0919 Vol 0842050, Sht 0077500 09.20% LHC 0.1241 0.1270 0.1250 b:s 1:2.22
0918 Vol 0695935, Sht 0033000 04.74% LHC 0.1250 0.1269 0.1255 b:s 1:2.71
0917 Vol 0437262, Sht 0053514 12.24% LHC 0.1251 0.1290 0.1251 b:s 1:1.80
0916 Vol 0590260, Sht 0057010 09.66% LHC 0.1251 0.1330 0.1251 b:s 1:2.36
0913 Vol 0605493, Sht 0065375 10.80% LHC 0.1255 0.1318 0.1281 b:s 1:1.09
0912 Vol 0711600, Sht 0169200 23.78% LHC 0.1251 0.1348 0.1251 b:s 1:1.73
0911 Vol 1043283, Sht 0182950 17.54% LHC 0.1255 0.3128 0.1255 b:s 1:2.07
0910 Vol 1250920, Sht 0139949 11.19% LHC 0.1290 0.1385 0.1291 b:s 1:2.20[87]
0909 Vol 0537787, Sht 0076725 14.27% LHC 0.1305 0.1350 0.1310 b:s 1:4.70[86]
0906 Vol 0726300, Sht 0037100 05.11% LHC 0.1300 0.1390 0.1305 b:s 1:4.96
0905 Vol 0240810, Sht 0007000 02.91% LHC 0.1305 0.1348 0.1305 b:s 1:7.67
0904 Vol 0260078, Sht 0060471 23.25% LHC 0.1300 0.1340 0.1310 b:s 1:2.05
0903 Vol 0852891, Sht 0055000 06.45% LHC 0.1300 0.1370 0.1300 b:s 1:2.27
[86] There were two AH trades totaling 19K FINRA-reported daily short sales don't include. Adding that to the FINRA trade volume raises it from 537,787 to my total and would lower the short percentage from 14.72% to my 13.78%. If the shares are also added to the short sales, the short volume moves from 76,725 to 95,725 and the short percentage would be 17.19%.
[87] There was one AH trade of 19K that FINRA-reported daily short sales don't include. Adding that to the FINRA trade volume raises it from 1,250,920 to my total and would lower the short percentage from 11.19% to my 11.10%. If the shares are also added to the short sales, the short volume moves from 139,949 to 150,047 and the short percentage would be 11.90%.
There was one pre-market trade of 10K that FINRA-reported daily short sales don't include. Adding that to the FINRA trade volume raises it from 1,307,672 to my total and would lower the short percentage from 5.77% to my 5.72%. If the shares are also added to the short sales, the short volume moves from 75,394 to 85,394 and the short percentage would be 6.48%.
[89] There was one after-market trade of 51K that FINRA-reported daily short sales don't include. Adding that to the FINRA trade volume raises it from 2,649,600 to my total and would lower the short percentage from 31.63% to my 31.58%. If the shares are also added to the short sales, the short volume moves from 838,193 to 843,193 and the short percentage would be 31.76%.
[90] There was one after-market trade of 5K that FINRA-reported daily short sales don't include. Adding that to the FINRA trade volume raises it from 2,083,880 to my total and would lower the short percentage from 28.86% to my 28.80%. If the shares are also added to the short sales, the short volume moves from 601,501 to 606,501 and the short percentage would be 29.03%.
[91] There was one pre-market trade of 5K that FINRA-reported daily short sales don't include. Adding that to the FINRA trade volume raises it from 2,978,470 to my total and would lower the short percentage from 35.71% to my 35.65%. If the shares are also added to the short sales, the short volume moves from 1,063,555 to 1,068,555 and the short percentage would be 35.82%.
[92] There was one pre-market trade of 5K that FINRA-reported daily short sales don't include. Adding that to the FINRA trade volume raises it from 3,092,833 to my total and would lower the short percentage from 19.93% to my 19.90%. If the shares are also added to the short sales, the short volume moves from 616,537 to 621,357 and the short percentage would be 20.06%.
[93] There were four pre-market trades totaling 45K that FINRA-reported daily short sales don't include. Adding that to the FINRA trade volume raises it from 2,873,365 to my total and would lower the short percentage from 28.73% to my 28.29%. If the shares are also added to the short sales, the short volume moves from 825,575 to 870,575 and the short percentage would be 29.83%.
[94] There was one pre-market trade of 10K that FINRA-reported daily short sales don't include. Adding that to the FINRA trade volume raises it from 2,093,489 to my total and would lower the short percentage from 21.93% to my 21.82%. If the shares are also added to the short sales, the short volume moves from 459,040 to 469,040 and the short percentage would be 22.30%.
[95] There was one AH trade of 5K that FINRA-reported daily short sales don't include. Adding that to the FINRA trade volume raises it from 608,756 to my total and would lower the short percentage from 7.88% to my 7.82%. If the shares are also added to the short sales, the short volume moves from 47,977 to 52,977 and the short percentage would be 8.63%.
[96] There was one AH trade of 50K that FINRA-reported daily short sales don't include. Adding that to the FINRA trade volume raises it from 1,287,910 to my total and would lower the short percentage from 34.46% to my 33.17%. If the shares are also added to the short sales, the short volume moves from 443,810 to 493,810 and the short percentage would be 36.91%.
[97] There were two pre-market trades totaling 15K that FINRA-reported daily short sales don't include. Adding that to the FINRA trade volume raises it from 1,853,919 to my total and would lower the short percentage from 29.05% to my 28.82%. If the shares are also added to the short sales, the short volume moves from 538,550 to 553,550 and the short percentage would be 29.62%.
[98] ABERRATION! FINRA-reported daily short sales trade volume is missing 195,700 shares of the daily trade volume. I've e-mailed FINRA for clarification - it could be case of partial volume which will be rectified on the next business day. There could be unreported short sales included in the (apparently) missing volume. Regardless, adding that to the FINRA trade volume raises it from 209,769 to my total and would lower the short percentage from 42.56% to my 22.02%. If new data is received Monday, the day's record will be updated and this note may be removed.
11/27/2013: EOD stuff partially copied to the concentrator.
# Trds: 72, MinTrSz: 100, MaxTrSz: 61000, Vol: 522193, AvTrSz: 7253
Min. Pr: 0.1155, Max Pr: 0.1219, VW Avg. Tr. Pr: 0.1172
# Buys, Shares: 9 54993, VW Avg Buy Pr: 0.1208
# Sells, Shares: 63 467200, VW Avg Sell Pr: 0.1167
# Unkn, Shares: 0 0, VW Avg Unk. Pr: 0.0000
Buy:Sell 1:8.50 (10.5% "buys"), DlyShts 30000 (5.75%), Dly Sht % of 'sells' 6.42%
The average of the lowest 20 VWAPs times 85% today is $0.0986 vs. $0.0987, $0.0988 and $0.0991 on prior days. 85% of today's VWAP is 0.0996 vs. $0.1006, $0.0974 and $0.0972 on prior days. These are potential prices for the next tranche of shares to the PIPErs.
Today, VWAP, trade volume, and daily short sales moved -0.96%, -34.46% and -71.84% respectively. With this being a day before Thanksgiving, I don't know how much weight we should give these readings.
Even with that in mind, the buy percentage dropping to 10.5% does concern me. Look at the trading breakdown and note that all the buys occurred in the highest price range, $0.1199-$0.1219. It was ~10.5% of day's volume. So ~90% of the day's trades were sellers stepping past the offers and directly hitting the bids.
It does match expected behavior with very low daily short volumes and percentages though. I'm guessing that some MM was long with incoming shares backing prior sell orders which had generated short sales the MM had already covered with buys at lower prices. This would logically result in lower daily short sales volume (although it could be due to such as intra-broker trades too), less price support from the market-makers and a higher "sell" percentage as the MM(s) cleaned out their portfolio. Looking at minimum trade prices, VWAPs and buy percentages over the last week, this seems reasonable.
That doesn't make me feel any better.
The 400K+ quantity bid at $0.11 is still there, untouched. After seeing the aggregate size of that potential support level shrink as higher bids from particular MMs masked these $0.11 bids, it is starting to return to the aggregate 700K+ level as VWAP continues to sink and folks apparently ask "Why bid higher?". Today we're seeing CANT 421K, NITE 292K, PERT 11K and TEJS 5K - ~730K. I expect this will grow some more starting next week.
Our late-day weakness today was, well, weak. I think it was because ARCA was absent all day. This left ATDF, BTIG and CDEL as the primary participants at the top of the offers most of the day. Since they often do seem to care about getting the best price they can, unlike ARCA who behaves as if price is no object, I believe the lack of ARCA explains the weak late-day weakness today.
The peeks at the asks today yielded only one increase and one unchanged. The other six were decreases. The bid moves were balanced between up and down - ten vs. eight. Remember these are arbitrary peeks and not complete tracking.
Here's a trading breakdown by arbitrary time-frames.
09:30-10:06: 016599 shrs, 03.18% of vol, VWAP $0.1214, 90.4% buys
10:38-10:54: 134300 shrs, 25.72% of vol, VWAP $0.1168, 00.0% buys
11:19-12:56: 072594 shrs, 13.90% of vol, VWAP $0.1186, 48.2% buys
13:04-14:04: 039350 shrs, 07.54% of vol, VWAP $0.1170, 00.0% buys
14:05-14:27: 096400 shrs, 18.46% of vol, VWAP $0.1165, 05.2% buys
15:01-15:25: 107700 shrs, 20.62% of vol, VWAP $0.1173, 00.0% buys
15:25-15:59: 056250 shrs, 10.77% of vol, VWAP $0.1157, 00.0% buys
Here's a breakdown by arbitrary price range.
$0.1155-$0.1160: 080850 shrs, 15.48% of vol, VWAP $0.1157, b:s , 0.0% buys
$0.1163-$0.1170: 314950 shrs, 60.31% of vol, VWAP $0.1168, b:s , 0.0% buys
$0.1171-$0.1185: 071400 shrs, 13.67% of vol, VWAP $0.1177, b:s , 0.0% buys
$0.1199-$0.1219: 054993 shrs, 10.53% of vol, VWAP $0.1208, b:s , 100% buys
On the traditional TA front we are still predominately trading below the 50-day SMA, still at $0.1206. Since 11/18 our trading has been like this. See today's trading breakdowns.
Our low stayed flat today as the medium-term descending channel support continued down, again increasing the gap. I said if this continues, I might begin to believe something positive might occur. Today we got a higher high, 1.58%, but volume was down ~34.5%, as detailed above. With volume down that much the higher high should be viewed with suspicion, especially with the VWAP weakening -0.96%. Also, keep in mind that 10% buy percentage was all trades at the day's highest prices.
As another cautionary flag, let's toss in that buy percentage, a non-traditional factor. While thinking of that, take a look at my experimental charts and note behavior of the various averages for buy percentage. Not a pretty sight and not a picture conducive to optimism for bullish price action currently.
My thought about the oscillators I watch are unchanged: with the price action being and the volume being (sporadically?) up, the oscillators I watch have continue early improvement and beginning to exit oversold in some cases. Others are around neutral readings. The accumulation and distribution remains very negative though, continuing to show increasing distribution.
As I've iterated a couple times now, there is no bullishness reflected in my experimental inflection point calculations yet - only reducing weakening from the flat behavior in the market. I noted yesterday "The flat action has been long enough that the reduction in weakening is becoming quite noticeable on my original chart. The three shorter periods have developed a noticeable trend up. The three longer periods are still undecided, but have shown some recent blips suggesting they may come to a more positive stance". Today's behavior interrupted that, bring the three longer-term calculations to increased weakening, along with the five-day, leaving only the 10 and 25-day calculations still suggesting reducing weakening.
Unlike my original calculations, my newer calculations and charts, sensitive to additional factors, have all periods in agreement - weakening rate, which was decreasing yesterday, is on the increase again.
Something of more concern, which I've not mentioned in some time, is the average trade size. Prior to the pipe deal the average trade sizes achieved some stability at a low range (see the chart) and began to climb after the deal as price eroded. This is as one might expect if there is a good deal of bullish investors that see the price erosion as a rising opportunity - maybe an improved risk/reward scenario.
But this behavior has taken a potentially negative turn. Three of the last four trading days have had average trade size below all averages - currently 8,561, 8,863, 8,510 and 7496 for the 10, 25, 50 and 100-day averages respectively. Further, three of the last four days have also been below a short-term rising trend support line which had been offering some hope that we might eventually break up from our current trading range. I think these smaller transaction sizes suggest market-makers are having to work much harder to make their money, which is not the case when bullish sentiment is strong and larger buyers are in the market.
If we could stabilize in this area I think we'd have a good chance of at least remaining in our sideways price trading range for a while longer. If average trade size continues to drop, I think it will be difficult.
N.B. Keep in mind that we have a relatively large aggregate quantity of shares bid at $0.11 and if we hit this range while PIPErs are flush with fresh shares we'll probably have a spike in the average trade size, for a day or two(?), while we have a deterioration in VWAP to around that level. Relative to the PIPErs available shares, this (currently) 400K-500K aggregate quantity is small and may not be support that can last very long.
OTC markets down 11/07 until ~15:00 resulting in an aberrant day! Keep that in mind when looking at numbers below!
Some day-to-day VWAP changes, with the end date shown and the percentage change from the prior day. Buy percentage is the last value on each line.
10/24 $0.1285 -02.80% 25.1%
10/25 $0.1254 -02.37% 27.8%
10/28 $0.1267 +01.00% 36.0%
10/29 $0.1274 +00.54% 55.6%
10/30 $0.1232 -03.25% 23.3%
10/31 $0.1222 -00.84% 21.2%
11/01 $0.1249 +02.20% 19.9%
11/04 $0.1289 +03.25% 33.5%
11/05 $0.1340 +03.94% 33.2%
11/06 $0.1272 -05.07% 24.3%
11/07 $0.1251 -01.68% 55.2%
11/08 $0.1229 -01.74% 38.9%
11/11 $0.1237 +00.62% 35.7%
11/12 $0.1201 -02.91% 28.3%
11/13 $0.1214 +01.07% 35.0%
11/14 $0.1139 -06.19% 31.7%
11/15 $0.1203 +05.69% 38.5%
11/18 $0.1206 +00.27% 43.5% MAN. ADJ'D. DATASET
11/19 $0.1155 -03.73% 23.6%
11/20 $0.1125 -02.57% 34.4%
11/21 $0.1136 +00.99% 47.2%
11/22 $0.1144 +00.66% 14.9%
11/25 $0.1145 +00.14% 34.9%
11/26 $0.1183 +03.28% 47.3%
11/27 $0.1172 -00.96% 10.5%
This week's daily estimated values (older dailys in prior EOD posts in prior instablog) for next share issue:
11/25: 20 lowest intra-day VWAPs in 40 days avg, $0.1162, x 85%: $0.0988
11/26: 20 lowest intra-day VWAPs in 40 days avg, $0.1161, x 85%: $0.0987
11/27: 20 lowest intra-day VWAPs in 40 days avg, $0.1160, x 85%: $0.0986
Vol, in K, for above days: 776.50, 796.76, 522.19.
Week ending summaries of PIPE financing estimated 85% share pricing, "Dly Sht % of 'sells'", and inflection points here are are in the latest daily post above.
11/26/2013: EOD stuff partially copied to the concentrator.
# Trds: 124 , MinTrSz: 100 , MaxTrSz: 82300 , Vol: 796756 , AvTrSz: 6425
Min. Pr: 0.1155 , Max Pr: 0.1200 , VW Avg. Tr. Pr: 0.1183
# Buys, Shares: 53 376829 , VW Avg Buy Pr: 0.1193
# Sells, Shares: 69 412927 , VW Avg Sell Pr: 0.1174
# Unkn, Shares: 2 7000 , VW Avg Unk. Pr: 0.1190
Buy:Sell 1:1.10 (47.3%) DlyShts 106540 (13.37%), Dly Sht % of 'sells' 25.80%
The average of the lowest 20 VWAPs times 85% today is $0.0987 vs $0.0988 and $0.0991 on prior days. 85% of today's VWAP is $0.1006 vs $0.0974 yesterday - at last something positive! These are potential prices for the next tranche of shares to the PIPErs.
Today, VWAP, trade volume, and daily short sales moved 3.28%, 2.61% and 79.48% respectively. As I've mentioned, the rise in daily short percentage towards the trend line above it is both erratic and something we need to see for any price movement. As predicted, we are seeing the lows of each "wave" move higher. We should the highs begin to move up too, but we have a short week. I don't know if this will affect the movement this week or not.
Our move to the ~$0.12 price level remains intact - it's today's high and the VWAP has moved to close to it too. Today's low, high and VWAP moved 3.13%, 0.00% and 3.28% respectively.
The 400K+ quantity bid at $0.11 is still there, untouched. Again, some of the other MMs' $0.11 bids were hidden as they had higher bids masking them.
We again had some additional larger bids similar to yesterday's. I won't detail them again until they seem to change. Right now they have had a few days of consistency.
No late-day weakness appeared today. I think it was because ARCA was playing hide 'n seek again. In early, disappeared after price dropped a bit, came back when it rose (too much?), etc. ATDF was their primary for top spot on the ask.
The bid and ask moves were both balanced between up and down. Remember these are arbitrary peeks and not complete tracking.
Here's a trading breakdown by arbitrary time-frames. NOTE: the 09:49-09:58 time-frame includes a 100K buy @ $0.1150, which had a big impact on both the time-frame results and the complete day's results due to the 100K constituting 12.88% of day's trade volume. It also included a 45K sell at $0.1130.
09:30-09:57: 056558 shrs, 07.10% of vol, VWAP $0.1197, 96.1% buys
10:07-10:58: 016093 shrs, 02.02% of vol, VWAP $0.1155, 1.2% buys
11:15-11:59: 036654 shrs, 04.60% of vol, VWAP $0.1184, 67.0% buys
12:01-13:29: 096625 shrs, 12.13% of vol, VWAP $0.1171, 35.5% buys
13:30-13:47: 005000 shrs, 00.63% of vol, VWAP $0.1175, 100.0% buys
14:02-14:16: 038400 shrs, 04.82% of vol, VWAP $0.1180, 0.0% buys
14:21-14:44: 162300 shrs, 20.37% of vol, VWAP $0.1194, 65.9% buys
14:46-15:08: 260099 shrs, 32.64% of vol, VWAP $0.1187, 40.8% buys
15:09-15:59: 125027 shrs, 15.69% of vol, VWAP $0.1168, 36.3% buys
Here's a breakdown by arbitrary price range.
$0.1155-$0.1168: 158178 shrs, 19.85% of vol, VWAP $0.1163, b:s 1:6.91, 12.6% buys
$0.1170-$0.1185: 319175 shrs, 40.06% of vol, VWAP $0.1178, b:s 1:4.86, 17.1% buys
$0.1189-$0.1199: 252953 shrs, 31.75% of vol, VWAP $0.1197, b:s 23.60:1, 93.3% buys
$0.1200-$0.1200: 066450 shrs, 08.34% of vol, VWAP $0.1200, 100% buys
On the traditional TA front we are still trading completely below the 50-day SMA, down to $0.1206 today from yesterday's $0.1208. Since 11/18 our trading was predominately below that metric.
Our low rose today while my medium-term descending channel support continued down, increasing the gap. If this continues, I might begin to believe something positive might occur. With the daily short sales behaving according to expectations, the possibility grows stronger it may continue within the channel for a longer period.
These comments are exactly the same as yesterday. With the price action being really sort of flat and the volume being up, the oscillators I watch have switched from reducing rate of weakening to starting to exit oversold, in some cases, and hovering around neutral readings in other cases. The accumulation and distribution remains very negative though, continuing to show increasing distribution.
I'm sticking to my thought that there is no bullishness reflected in my experimental inflection point calculations yet - only reducing weakening from the flat behavior in the market. However, the flat action has been long enough that the reduction in weakening is becoming quite noticeable on my original chart. The three shorter periods have developed a noticeable trend up. The three longer periods are still undecided, but have shown some recent blips suggesting they may come to a more positive stance.
My newer calculations and charts, sensitive to additional factors, have all periods in agreement - weakening rate is definitely reducing. If the current trading behavior continues, it won't take much for them to start forming the pattern I want to see for a bullish indication. But it's not here yet.
OTC markets down 11/07 until ~15:00 resulting in an aberrant day! Keep that in mind when looking at numbers below!
Some day-to-day VWAP changes, with the end date shown and the percentage change from the prior day. Buy percentage is the last value on each line.
10/24 $0.1285 -02.80% 25.1%
10/25 $0.1254 -02.37% 27.8%
10/28 $0.1267 +01.00% 36.0%
10/29 $0.1274 +00.54% 55.6%
10/30 $0.1232 -03.25% 23.3%
10/31 $0.1222 -00.84% 21.2%
11/01 $0.1249 +02.20% 19.9%
11/04 $0.1289 +03.25% 33.5%
11/05 $0.1340 +03.94% 33.2%
11/06 $0.1272 -05.07% 24.3%
11/07 $0.1251 -01.68% 55.2%
11/08 $0.1229 -01.74% 38.9%
11/11 $0.1237 +00.62% 35.7%
11/12 $0.1201 -02.91% 28.3%
11/13 $0.1214 +01.07% 35.0%
11/14 $0.1139 -06.19% 31.7%
11/15 $0.1203 +05.69% 38.5%
11/18 $0.1206 +00.27% 43.5% MAN. ADJ'D. DATASET
11/19 $0.1155 -03.73% 23.6%
11/20 $0.1125 -02.57% 34.4%
11/21 $0.1136 +00.99% 47.2%
11/22 $0.1144 +00.66% 14.9%
11/25 $0.1145 +00.14% 34.9%
11/26 $0.1183 +03.28% 47.3%
This week's daily estimated values (older dailys in prior EOD posts in prior instablog) for next share issue:
11/25: 20 lowest intra-day VWAPs in 40 days avg, $0.1162, x 85%: $0.0988
11/26: 20 lowest intra-day VWAPs in 40 days avg, $0.1161, x 85%: $0.0987
Vol, in K, for above days: 776.50, 796.76.
Week ending summaries of PIPE financing estimated 85% share pricing, "Dly Sht % of 'sells'", and inflection points here are in the latest daily post above.
11/25/2013: EOD stuff partially copied to the concentrator.
# Trds: 86, MinTrSz: 500, MaxTrSz: 100000, Vol: 776502, AvTrSz: 9029
Min. Pr: 0.1120, Max Pr: 0.1200, VW Avg. Tr. Pr: 0.1145
# Buys, Shares: 26 271261, VW Avg Buy Pr: 0.1163
# Sells, Shares: 59 485241, VW Avg Sell Pr: 0.1137
# Unkn, Shares: 1 20000, VW Avg Unk. Pr: 0.1125
Buy:Sell 1:1.79 (34.9% "buys"), DlyShts 59362 (7.64%), Dly Sht % of 'sells' 12.23%
The average of the lowest 20 VWAPs times 85% today is $0.0988 vs. yesterday's $0.0991. 85% of today's VWAP is $0.0974. These are potential prices for the next tranche of shares to the PIPErs.
Today, VWAP, trade volume, and daily short sales moved 0.14%, 91.20% and -36.71% respectively. As I mentioned yesterday, the rise in daily short percentage towards the trend line above it is erratic in behavior. We should continue seeing the lows of each "wave" move higher, along with the highs, over the days ahead. This happened today with the low percentage (21.42%, 5.45%, 3.93%, 6.04%, 23.10% and 7.64% today).
In the past few days I've mentioned "... a move to the mid-point of ~$0.12 or so would not be unexpected. Much higher would be unexpected, all things considered". Still holding there with the high of $0.12. Today's low, high and VWAP moved 0.00%, 0.17% and 0.14% respectively.
The 400K+ quantity bid at $0.11 is still there, untouched. Again, some of the other MMs' $0.11 bids were hidden as they had higher bids masking them.
We again had some additional larger bids ($0.111 CDEL 61K, $0.113 ATDF 90K, $0.1135 100K ETRF, $0.1116 98K NITE - yesterday 100K at $0.111) and a few somewhat larger offers continue to appear (BNCH $0.12 x 40K and CDEL $0.122 x 50K).
Late-day weakness decided to appear in the morning today. Our drop in the afternoon was only a few tenths of a penny, as seen in the trading breakdown below. I believe this was from ARCA coming in early and then leaving early, rather than hanging around as is often the case.
The bid moves were balanced between up and down and most on the offer were down (12 vs. 5 - but remember these are arbitrary peeks and not complete tracking).
ARCA was in at 9:39 but after tussling with (mostly) ATDF all morning was gone when I checked at 12:20. ARCA did not reappear. They seem to have a habit of doing this after they've moved price lower (check the time when VWAP begins to recover a bit in the trading breakdown by time).
Here's a trading breakdown by arbitrary time-frames. NOTE: the 09:49-09:58 time-frame includes a 100K buy @ $0.1150, which had a big impact on both the time-frame results and the complete day's results due to the 100K constituting 12.88% of day's trade volume. It also included a 45K sell at $0.1130.
09:30-09:37: 042500 shrs, 05.47% of vol, VWAP $0.1195, 91.8% buys
09:39-09:48: 176974 shrs, 22.79% of vol, VWAP $0.1139, 0.0% buys
09:49-09:58: 201500 shrs, 25.95% of vol, VWAP $0.1139, 51.6% buys
10:01-10:49: 096099 shrs, 12.38% of vol, VWAP $0.1135, 31.2% buys
11:21-11:50: 007262 shrs, 00.94% of vol, VWAP $0.1137, 51.8% buys
12:08-12:56: 049500 shrs, 06.37% of vol, VWAP $0.1159, 21.2% buys
13:00-13:58: 015000 shrs, 01.93% of vol, VWAP $0.1179, 100.0% buys
14:01-14:42: 035500 shrs, 04.57% of vol, VWAP $0.1143, 0.0% buys
15:21-15:57: 152167 shrs, 19.60% of vol, VWAP $0.1148, 45.3% buys
Here's a breakdown by arbitrary price range.
$0.1120-$0.1136: 267329 shrs, 34.43% of vol, VWAP $0.1130, b:s 1:26.48, 3.4% buys
$0.1140-$0.1150: 407673 shrs, 52.50% of vol, VWAP $0.1145, b:s 1:1.49, 40.2% buys
$0.1160-$0.1180: 052500 shrs, 06.76% of vol, VWAP $0.1177, b:s 16.50:1, 94.3% buys
$0.1198-$0.1200: 049000 shrs, 06.31% of vol, VWAP $0.1199, 100% buys
On the traditional TA front we are now trading completely below the 50-day SMA, $0.1208 today. Since 11/18 our trading was predominately below that metric. As I've mentioned, still no signs, other than in some of my experimental stuff, that this may change soon. My experimental stuff continues to show reducing weakening - not to be mistaken for strengthening! They are, essentially, reflecting the long period of action dwelling in a narrow band of behavior. This is an improvement from the long period of fairly constant downward movement in the past.
Our low stayed flat again at $0.1120 while my medium-term descending channel support continued down, leaving the low above it by a tiny amount again. With the daily short sales behaving according to expectations, the possibility still exists it may continue within the channel for a longer period.
With the price action being really sort of flat and the volume being up, the oscillators I watch have switched from reducing rate of weakening to starting to exit oversold, in some cases, and hovering around neutral readings in other cases. The accumulation and distribution remains very negative though, continuing to show increasing distribution.
I'm sticking to my thought that there is no bullishness reflected in my experimental inflection point calculations yet - only reducing weakening from the flat behavior in the market.
OTC markets down 11/07 until ~15:00 resulting in an aberrant day! Keep that in mind when looking at numbers below!
Some day-to-day VWAP changes, with the end date shown and the percentage change from the prior day. Buy percentage is the last value on each line.
10/24 $0.1285 -02.80% 25.1%
10/25 $0.1254 -02.37% 27.8%
10/28 $0.1267 +01.00% 36.0%
10/29 $0.1274 +00.54% 55.6%
10/30 $0.1232 -03.25% 23.3%
10/31 $0.1222 -00.84% 21.2%
11/01 $0.1249 +02.20% 19.9%
11/04 $0.1289 +03.25% 33.5%
11/05 $0.1340 +03.94% 33.2%
11/06 $0.1272 -05.07% 24.3%
11/07 $0.1251 -01.68% 55.2%
11/08 $0.1229 -01.74% 38.9%
11/11 $0.1237 +00.62% 35.7%
11/12 $0.1201 -02.91% 28.3%
11/13 $0.1214 +01.07% 35.0%
11/14 $0.1139 -06.19% 31.7%
11/15 $0.1203 +05.69% 38.5%
11/18 $0.1206 +00.27% 43.5% MAN. ADJ'D. DATASET
11/19 $0.1155 -03.73% 23.6%
11/20 $0.1125 -02.57% 34.4%
11/21 $0.1136 +00.99% 47.2%
11/22 $0.1144 +00.66% 14.9%
11/25 $0.1145 +00.14% 34.9%
This week's daily estimated values (older dailys in prior EOD posts in prior instablog) for next share issue:
11/25: 20 lowest intra-day VWAPs in 40 days avg, $0.1162, x 85%: $0.0988
Vol, in K, for above days: 776.50.
Week ending summaries of PIPE financing estimated 85% share pricing, "Dly Sht % of 'sells'", and inflection points here are in the latest daily post above.
11/22/2013: EOD stuff partially copied to the concentrator.
# Trds: 62, MinTrSz: 500, MaxTrSz: 27600, Vol: 406110, AvTrSz: 6550
Min. Pr: 0.1120, Max Pr: 0.1198, VW Avg. Tr. Pr: 0.1144
# Buys, Shares: 11 60484, VW Avg Buy Pr: 0.1167
# Sells, Shares: 51 345626, VW Avg Sell Pr: 0.1140
# Unkn, Shares: 0 0, VW Avg Unk. Pr: 0.0000
Buy:Sell 1:5.71 (14.9% "buys"), DlyShts 93800 (23.1%), Dly Sht % of 'sells' 27.14%
If PIPErs received shares today they would pay only $0.0991 vs. yesterday's $0.0995.
Yesterday I said, in part, "... but when the daily short sales get so low we sometimes get an immediate stop of the VWAP descent. Sometimes it takes a few days though". I also said "... the past behavior suggests an erratic (but not always) trend up in daily short sales again until it intersects (or sometimes just "nears") the trend line ...".
Today, VWAP, trade volume, and daily short sales moved 0.66%, 44.36% and 451.76% respectively. Following the identified patterns, the daily short percentage moved to 23.1% from yesterday's 6.04%. There may seem a disconnect since the higher short percentage came on lower buy percentage, counter to one of the things I look for. But this is OK because we had come off the extreme low of daily short sale percentage and the normal trend in that case is for the short percentage to begin moving towards the trend line above regardless of "buy" strength. So we're still on-script.
Following the script, I wrote yesterday "While this is happening, the VWAP price trend should be generally flat, at worst, with an upward bias also possible. It will not be a large upward bias though, ... ". In my traditional TA comments I said "Looking at the traditional Bollingers (20 period), we have been bumping the lower limit and a move to the mid-point of ~$0.12 or so would not be unexpected. Much higher would be unexpected, all things considered".
Today we hit our high at $0.1198 (+4.17% from the prior day's high of $0.115) and our low was $0.112.
The 400K+ quantity bid at $0.11 is still there, untouched, which may act as support later in the game. Again, some of those bids were hidden as the MMs had higher bids masking the $0.11 bids from those MMs.
We again had some additional larger bids ($0.111: NITE 100K and CDEL 61K) and some larger asks also appeared (BNCH $0.12 x 55K and CDEL $0.122x50K).
Today was another day of little late-day weakness, but also no late-day strength.
Regardless, most of the moves on the bid were upwards and most on the ask were down. But as various levels of the ask were taken substantially higher asks, were exposed and became the best ask. Trading range tended to move up to it for a while before ...
The usual suspect sellers made another move. These included predominately ARCA, NITE and ATDF. ATDF was the most aggressive, followed by ARCA. NITE was aggressive only early in the day.
With a narrow spread and low volume again there's no utility in the trading breakdowns, so I'll skip them until something occurs that suggests usefulness.
On the traditional TA front we continue trading predominately below the 50-day SMA, $0.121 today, since 11/18. Still no signs, other than in some of my experimental stuff, that this may change soon. Yesterday I mentioned we had been bumping the bottom of the traditional Bollingers (20 period) a move to the mid-point of ~$0.12 or so would not be unexpected. As mentioned above, it played as expected. That removes the Bollinger band as a predictive consideration and offers no suggestion either way.
Our low stayed flat (+0.00%) while my medium-term descending channel support continued down, leaving the low above it by a tiny amount. With the daily short sales continuing to trend up (volume +451.8% today), there's still a chance it may stay within the channel for a longer period, as I mentioned yesterday, for maybe another week or so?
With the price action being really sort of flat the oscillators I watch continue weakening at a slower rate.
I had mentioned yesterday the experimental inflection point calculations' big positive moves in the 5-day rate of change and most were due to some large negative numbers falling out of the respective periods. I said I don't assign much weight to a suggestion of some bullish action coming yet. But with stability in the buy;sell, daily short sales and price, I said we should see continued improvement in these derivatives of the inflection point calculations. We did see this and the changes were much smaller. I'm sticking to my thought that there is no bullishness reflected in these yet - only reducing weakening from the flat behavior in the market.
OTC markets down 11/07 until ~15:00 resulting in an aberrant day! Keep that in mind when looking at numbers below!
Some day-to-day VWAP changes, with the end date shown and the percentage change from the prior day. Buy percentage is the last value on each line.
10/24 $0.1285 -02.80% 25.1%
10/25 $0.1254 -02.37% 27.8%
10/28 $0.1267 +01.00% 36.0%
10/29 $0.1274 +00.54% 55.6%
10/30 $0.1232 -03.25% 23.3%
10/31 $0.1222 -00.84% 21.2%
11/01 $0.1249 +02.20% 19.9%
11/04 $0.1289 +03.25% 33.5%
11/05 $0.1340 +03.94% 33.2%
11/06 $0.1272 -05.07% 24.3%
11/07 $0.1251 -01.68% 55.2%
11/08 $0.1229 -01.74% 38.9%
11/11 $0.1237 +00.62% 35.7%
11/12 $0.1201 -02.91% 28.3%
11/13 $0.1214 +01.07% 35.0%
11/14 $0.1139 -06.19% 31.7%
11/15 $0.1203 +05.69% 38.5%
11/18 $0.1206 +00.27% 43.5% MAN. ADJ'D. DATASET
11/19 $0.1155 -03.73% 23.6%
11/20 $0.1125 -02.57% 34.4%
11/21 $0.1136 +00.99% 47.2%
11/22 $0.1144 +00.66% 14.9%
This week's daily estimated values (older dailys in prior EOD posts in prior instablog) for next share issue:
11/18: 20 lowest intra-day VWAPs in 40 days avg, $0.1182, x 85%: $0.1004
11/19: 20 lowest intra-day VWAPs in 40 days avg, $0.1179, x 85%: $0.1002
11/20: 20 lowest intra-day VWAPs in 40 days avg, $0.1175, x 85%: $0.0999
11/21: 20 lowest intra-day VWAPs in 40 days avg, $0.1170, x 85%: $0.0995
11/22: 20 lowest intra-day VWAPs in 40 days avg, $0.1166, x 85%: $0.0991
Vol, in K, for above days: 1373.74, 1332.68, 582.92, 281.32 and 406.11.
Week ending summaries of PIPE financing estimated 85% share pricing, "Dly Sht % of 'sells'", and inflection points here are are in the latest daily post above.
11/21/2013: EOD stuff partially copied to the concentrator.
# Trds: 36 , MinTrSz: 500 , MaxTrSz: 26000 , Vol: 281320 , AvTrSz: 7814
Min. Pr: 0.1120 , Max Pr: 0.1150 , VW Avg. Tr. Pr: 0.1136
# Buys, Shares: 18 160820 , VW Avg Buy Pr: 0.1138
# Sells, Shares: 17 116500 , VW Avg Sell Pr: 0.1134
# Unkn, Shares: 1 4000 , VW Avg Unk. Pr: 0.1129
Buy:Sell 1.38:1 (57.2% "buys") , DlyShts 17000 (6.04%), Dly Sht % of 'sells' 14.59%
If PIPErs received shares today they would pay only $0.995 vs. yesterday's $0.0999.
Yesterday VWAP, trade volume and daily short sales volumes were down -2.57%, -56.26% and -68.42% respectively. The daily short sale percentage was down to 3.93%. The day before I had said "Likely down on the VWAP for at least several more days". But when the daily shorts hit 3.93% yesterday, I should have revised my expectations and failed to do so. The other items behaved as expected but when the daily short sales get so low we sometimes get an immediate stop of the VWAP descent. Sometimes it takes a few days though.
Today, VWAP, trade volume, and daily short sales moved 0.99%, -51.7% and -25.9% respectively. In a comment today I said, in part, "... makes me think we'll see a higher daily short sale percentage today even though the absolute volume will be low". That expectation was met. I mention this only because seeing results more-or-less as expected gives me comfort that I am understanding things correctly.
With that in hand, the past behavior suggests an erratic (but not always) trend up in daily short sales again until it intersects (or sometimes just "nears") the trend line. If a new cycle is beginning, it may penetrate the trend line and get rather high, although the shape of this cycle suggests that's less likely.
While this is happening, the VWAP price trend should be generally flat, at worst, with an upward bias also possible. It will not be a large upward bias though, as can be plainly seen on the price and volume charts, if the patterns conform to past behavior. Today supports this with the intra-day high and low up just 0.81% and 0.88% respectively.
We still haven't hit the potential support that may exist at $0.11, where CANT maintains their 421K bid, totaling 529K with the others that have joined in. Today CANT and a couple others were still there but several that had been there were all at higher bids today. So we could only see 491K bid at $0.11 today, due to the higher bids "masking" the lower bids on Level 2.
With the daily short sales and VWAP behavior (and we mustn't overlook the declining trade volume), I don't think we'll test $0.11 until we start another down leg in the daily short sales or the PIPErs receive another tranche of dirt-cheap shares. These two events may coincide.
Again today we had no strong start. In fact, with only a 3/10ths of a penny spread, the only strength was "flat". Movement on the bids were almost exclusively upward - even when lower bids were uncovered, one of the usual suspects almost immediately appeared with a higher bid, keeping the market from moving down much at all.
On the ask side, movement was mixed but tightly constrained between $0.113 and $0.1148 all day, finishing to the higher side late in the day.
We did have some other larger bids again (NITE $0.111x10³K, CSTI $0.1105x50K). On the ask side some larger offers were from BNCH at $0.12 x 55K and CDEL at $0.122 x 50K. These never got that close to the top of the queue though because ARCA was in from 10:10 onward and was competing, mostly, with ATDF to sell. At various points CANT, NITE and CSTI also appeared with the best offers, keeping the market upside constrained.
With the narrow spread and low volume there's no utility in the trading breakdowns, so I'll skip them until something occurs that suggests usefulness.
On the traditional TA front we've now been trading predominately below the 50-day SMA since 11/18. There are no signs, other than in some of my experimental stuff, that this may change soon. Looking at the traditional Bollingers (20 period), we have been bumping the lower limit and a move to the mid-point of ~$0.12 or so would not be unexpected. Much higher would be unexpected, all things considered.
Our low continues riding my medium-term descending channel support. Yesterday I said I don't expect it to hold for long with what's going on. But with the daily short sales beginning to rise, there's a chance it may stay within the channel for a longer period - another week or so? The oscillators I watch are weakening at a slower rate now, as would be expected, and momentum has actually reversed and begun to improve, reading still below neutral though at ~0.934.
In a normal trading environment I would judge all this as possibly indicating consolidation with a likely bounce to start a leg up to the descending resistance of the medium-term channel, around $0.131 currently. There's a longer-term descending resistance currently at ~$0.128 that would have to be breached first though. In this market, with a new tranche of PIPEr shares due out in the first week of December, I would be surprised if we got too close to either of those marks, even with the daily short sales percentage on the rise (apparently - one step up is really too early to determine if the trend has started).
Both my original and newer experimental inflection point calculations had some big positive moves in the 5-day rate of change. Most of these are due to some large negative numbers falling out of the respective periods, so I don't assign much weight to a suggestion of some bullish action coming ... yet. However, with the buy;sell, daily short sales and price all stabilizing for the moment, we should see continued improvement in these derivatives of the inflection point calculations as less radical numbers enter and more radical negatives fall out of the calculations.
Regarding my newer version I said "If the positive action of today doesn't hold that negative pattern should begin very quickly to develop again". The 5 and 10-day inflection points, reflecting reduced rate of weakening, were countered by the longer-term calculations suggesting increased rate of weakening. The changes today negate that assessment. I believe the charts will continue to reflect reduced weakening in all periods for a while before the expected reflection of a trend down can reappear, if that is indeed what's in place.
OTC markets down 11/07 until ~15:00 resulting in an aberrant day! Keep that in mind when looking at numbers below!
Some day-to-day VWAP changes, with the end date shown and the percentage change from the prior day. Buy percentage is the last value on each line.
10/24 $0.1285 -02.80% 25.1%
10/25 $0.1254 -02.37% 27.8%
10/28 $0.1267 +01.00% 36.0%
10/29 $0.1274 +00.54% 55.6%
10/30 $0.1232 -03.25% 23.3%
10/31 $0.1222 -00.84% 21.2%
11/01 $0.1249 +02.20% 19.9%
11/04 $0.1289 +03.25% 33.5%
11/05 $0.1340 +03.94% 33.2%
11/06 $0.1272 -05.07% 24.3%
11/07 $0.1251 -01.68% 55.2%
11/08 $0.1229 -01.74% 38.9%
11/11 $0.1237 +00.62% 35.7%
11/12 $0.1201 -02.91% 28.3%
11/13 $0.1214 +01.07% 35.0%
11/14 $0.1139 -06.19% 31.7%
11/15 $0.1203 +05.69% 38.5%
11/18 $0.1206 +00.27% 43.5% MAN. ADJ'D. DATASET
11/19 $0.1155 -03.73% 23.6%
11/20 $0.1125 -02.57% 34.4%
11/21 $0.1136 +00.99% 47.2%
This week's daily estimated values (older dailys in prior EOD posts in prior instablog) for next share issue:
11/18: 20 lowest intra-day VWAPs in 40 days avg, $0.1182, x 85%: $0.1004
11/19: 20 lowest intra-day VWAPs in 40 days avg, $0.1179, x 85%: $0.1002
11/20: 20 lowest intra-day VWAPs in 40 days avg, $0.1175, x 85%: $0.0999
11/21: 20 lowest intra-day VWAPs in 40 days avg, $0.1170, x 85%: $0.0995
Vol, in K, for above days: 1373.74, 1332.68, 582.92 and 281.32.
Week ending summaries of PIPE financing estimated 85% share pricing, "Dly Sht % of 'sells'", and inflection points here are in the latest daily post above.
11/20/2013: EOD stuff partially copied to the concentrator.
# Trds: 59, MinTrSz: 150, MaxTrSz: 90000, Vol: 582923, AvTrSz: 9880
Min. Pr: 0.1111, Max Pr: 0.1140, VW Avg. Tr. Pr: 0.1125
# Buys, Shares: 24 200317, VW Avg Buy Pr: 0.1133
# Sells, Shares: 35 382606, VW Avg Sell Pr: 0.1121
# Unkn, Shares: 0 0, VW Avg Unk. Pr: 0.0000
Buy:Sell 1:1.91 (34.4% "buys"), DlyShts 22932 (3.93.%), Dly Sht % of 'sells' 5.99%
First things first! If PIPErs received shares today they would pay only $0.0999! This is the first occurrence of the 85% price being below $0.10.
Recall yesterday that VWAP, trade volume and daily short sales volumes were down -3.73%, -2.99% and -75.32% respectively. And I said "The daily short sales percentage says no upside here. Likely down on the VWAP for at least several more days". Today VWAP, trade volume and daily short sales volumes were down -2.57%, -56.26% and -68.42% respectively. The daily short sale percentage was down to 3.93%.
Bad ju-ju is in the air!
We haven't hit the potential support that may exist at $0.11 where CANT maintains their 421K bid, totaling 529K with the others that have joined in, but the "sells" percentage, which as of yesterday has averaged ~67.3% since 10/30, suggests that this potential support volume will be easily overwhelmed. OTOH, today's total volume was less than the total of those $0.11 bid. If everyone holds their position and volume keeps sinking, maybe we get lucky. Today's sell percentage was 65.6%.
Today was unusual: no strong start - in fact no strength anywhere today. See the trading breakdowns below. ARCA was in from the start on the ask, but they really had little to do with all this. Bid sat at $0.112 for a very long time with no movement and NITE, ATDF and CSTI did most of the lowering of the offers. CANT made a token appearance again. ATDF had an offer of 100K early on, but I suspect they gave up and just hit the bid with those shares, for which they were asking $0.1195. I suspect this because our largest trade was a 90K "sell" and had some larger (>= 10K) "sells" right around it. Never saw that offer again shortly after the open, but it could have been masked by other ATDF better offers. Tomorrow will probably tell the tale.
ATDF also had a 73K bid in at $0.111.
Here's some arbitrary snapshots of ending time, buy percentage, VWAP and volume. The first three values are for the period end and the last three are cumulative.
10:11:28 10.37% 0.1122 195250 10.37% 0.1122 195250
10:40:09 27.06% 0.1127 141500 17.38% 0.1124 336750
11:43:11 96.81% 0.1135 031332 24.14% 0.1125 368082
12:46:35 89.40% 0.1130 095750 37.61% 0.1126 463832
15:13:37 80.66% 0.1125 025850 39.89% 0.1126 489682
15:56:17 05.36% 0.1121 093241 34.36% 0.1125 582923
On the traditional TA front that new descending trading channel I constructed yesterday seems to be valid. Our low is riding the descending support down, but I really don't expect it to hold for long with what's going on. There's little change in the oscillators I watch - all weak and getting weaker.
In a normal trading environment I would judge the falling volume as possibly indicating consolidation, but as I've mentioned I think it means we'll break below that descending support into the $0.10xx area soon.
FYI: since 11/05's VWAP of $0.1340 we've seen it drop -16.04%.
Intra-day trading breakdown by arbitrary time-frames.
09:30-09:57: 177750 shrs, 30.49% of vol, VWAP $0.1122, 11.4% buys
10:11-10:40: 159000 shrs, 27.28% of vol, VWAP $0.1126, 24.1% buys
11:19-12:24: 126932 shrs, 21.78% of vol, VWAP $0.1131, 91.3% buys
12:46-15:13: 026000 shrs, 04.46% of vol, VWAP $0.1125, 80.2% buys
15:13-15:56: 093241 shrs, 16.00% of vol, VWAP $0.1121, 05.4% buys
Here's the intra-day trading breakdown by arbitrary price range.
$0.1111-$0.1125: 333526 shrs, 57.22% of vol, VWAP $0.1120, b:s 1:22.60, 4.2% buys
$0.1127-$0.1140: 249397 shrs, 42.78% of vol, VWAP $0.1132, b:s 2.95:1, 74.7% buys
Both my original and newer experimental inflection point calculations remain in a general weakening trend.
Yesterday I said "my newer version ... It doesn't mean bullishness is here because the pattern [that] guides me is a long way from appearing on the upside. However, the strong start to a pattern suggesting a down move is not out of play. If the positive action of today doesn't hold that negative pattern should begin very quickly to develop again". The 5 and 10-day inflection points are reflecting reduced rte of weakening, but this is countered by the longer-term calculations suggesting increased rate of weakening.
OTC markets down 11/07 until ~15:00 resulting in an aberrant day! Keep that in mind when looking at numbers below!
Some day-to-day VWAP changes, with the end date shown and the percentage change from the prior day. Buy percentage is the last value on each line.
10/24 $0.1285 -02.80% 25.1%
10/25 $0.1254 -02.37% 27.8%
10/28 $0.1267 +01.00% 36.0%
10/29 $0.1274 +00.54% 55.6%
10/30 $0.1232 -03.25% 23.3%
10/31 $0.1222 -00.84% 21.2%
11/01 $0.1249 +02.20% 19.9%
11/04 $0.1289 +03.25% 33.5%
11/05 $0.1340 +03.94% 33.2%
11/06 $0.1272 -05.07% 24.3%
11/07 $0.1251 -01.68% 55.2%
11/08 $0.1229 -01.74% 38.9%
11/11 $0.1237 +00.62% 35.7%
11/12 $0.1201 -02.91% 28.3%
11/13 $0.1214 +01.07% 35.0%
11/14 $0.1139 -06.19% 31.7%
11/15 $0.1203 +05.69% 38.5%
11/18 $0.1206 +00.27% 43.5% MAN. ADJ'D. DATASET
11/19 $0.1155 -03.73% 23.6%
11/20 $0.1125 -02.57% 34.4%
This week's daily estimated values (older dailys in prior EOD posts in prior instablog) for next share issue:
11/18: 20 lowest intra-day VWAPs in 40 days avg, $0.1182, x 85%: $0.1004
11/19: 20 lowest intra-day VWAPs in 40 days avg, $0.1179, x 85%: $0.1002
11/20: 20 lowest intra-day VWAPs in 40 days avg, $0.1175, x 85%: $0.0999
Vol, in K, for above days: 1373.74, 1332.68 and 582.92.
Week ending summaries of PIPE financing estimated 85% share pricing, "Dly Sht % of 'sells'", and inflection points here are in the latest daily post above.
11/19/2013: EOD stuff partially copied to the concentrator.
# Trds: 125, MinTrSz: 500, MaxTrSz: 95332, Vol: 1332681, AvTrSz: 10661
Min. Pr: 0.1111, Max Pr: 0.1239, VW Avg. Tr. Pr: 0.1155
# Buys, Shares: 35 314432, VW Avg Buy Pr: 0.1158
# Sells, Shares: 89 1007249, VW Avg Sell Pr: 0.1154
# Unkn, Shares: 1 11000, VW Avg Unk. Pr: 0.1160
Buy:Sell 1:3.20 (23.6% buys"), DlyShts 72610 (5.45%), Dly Sht % of 'sells' 7.21%
VWAP, trade volume and daily short sales volumes were down -3.73%, -2.99% and -75.32% respectively. The daily short sales percentage says no upside here. Likely down on the VWAP for at least several more days. Some support may exist at $0.11 if CANT maintains their 421K bid and others join in, but the "sells" percentage, which has averaged ~67.3% since 10/30, suggests that this potential support volume will be easily overwhelmed.
The maximum cumulative buy percentage seen today, 29.69%, occurred at 12:10. It was generally "flat" throughout the day as price drifted lower (see the trading breakdowns below).
The usual: started strong on price and buy percentage with reasonable volume. ARCA made an early brief appearance on the bid again. They didn't have to hang around though as the bids were supported, early on, by NITE, ATDF and BNCH. Didn't do much good as bid was down from $0.12 at 9:45 (ATDF, BNCH) to $0.115 at 10:46 (ATDF, CDEL). Bids stayed in the $0.115-$0.116 range through 15:38. At 15:44 bid was $0.1111.
On the ask side, we started at $0.124 at 09:33 and dropped continuously through 11:24 when we hit $0.1155. Offers stayed in the $0.115x-$0.116x area through 15:38. At 15:44 it was $0.1115. Although ATDF participated in the usual fashion, they were outclassed by ARCA and NITE, which provided most of the downward pressure. However, ATDF did provided some large-volume offers at various times.
Larger bid sizes were also seen from ATDF and NITE. This gave the sellers a nice sink-hole in which to dump and we ended with the average trade size on the high side again.
Here's some arbitrary snapshots of ending time, buy percentage, VWAP and volume. The first three values are for the period end and the last three are cumulative.
09:58:02 26.23% 0.1205 042700 26.23% $0.1205 0042700
10:28:42 20.91% 0.1170 318055 21.54% $0.1174 0360755
10:54:51 37.47% 0.1155 122750 25.58% $0.1169 0483505
12:10:31 46.48% 0.1160 118254 29.69% $0.1167 0601759
14:45:25 02.30% 0.1158 108706 25.50% $0.1166 0710465
15:29:32 09.53% 0.1156 157400 22.60% $0.1164 0867865
15:40:12 29.17% 0.1150 292142 24.26% $0.1161 1160007
15:59:55 19.15% 0.1116 172674 23.59% $0.1155 1332681
On the traditional TA front there's not much new - just continued worsening. We continue to trade predominately below the support/resistance of $0.12 and closed very new the low of the day on late-day weakness. Our trend of generally lower highs continues. Although volume is trending down (another -2.99% today) it's still high enough that I don't suspect consolidation is what's happening here.
Our lows and closes are pushing the lower Bollinger (four of the last six days), with all the oscillators I watch continuing to weaken. MFI, Williams %R and stochastic are all in oversold and I don't see a quick exit. Momentum is down to ~0.91. RSI down to ~42.7. Accumulation and distribution, which was hovering around -1.44 in early July is now down at -42.7 - no surprise there.
I've been able now to construct a new descending trading channel that began mid-August. Except for the descent to $0.10xx 10/3-10/10, the lows have been riding the descending support, currently about $0.111. I suspect we'll not soon challenge the resistance, currently about $0.134.
Intra-day trading breakdown by arbitrary time-frames.
09:36-09:58: 042700 shrs, 03.20% of vol, VWAP $0.1205, 26.2% buys
10:08-10:28: 318055 shrs, 23.87% of vol, VWAP $0.1170, 20.9% buys
10:46-10:54: 122750 shrs, 09.21% of vol, VWAP $0.1155, 37.5% buys
11:02-12:54: 126254 shrs, 09.47% of vol, VWAP $0.1160, 45.5% buys
13:41-14:13: 057268 shrs, 04.30% of vol, VWAP $0.1158, 0.0% buys
14:28-15:14: 044938 shrs, 03.37% of vol, VWAP $0.1160, 0.0% buys
15:20-15:29: 155900 shrs, 11.70% of vol, VWAP $0.1156, 9.6% buys
15:32-15:44: 332142 shrs, 24.92% of vol, VWAP $0.1147, 25.7% buys
15:46-15:59: 132674 shrs, 09.96% of vol, VWAP $0.1113, 24.9% buys
Here's the intra-day trading breakdown by arbitrary price range.
$0.1111-$0.1121: 162674 shrs, 12.21% of vol, VWAP $0.1114, b:s 1:3.92, 20.3% buys
$0.1140-$0.1155: 567660 shrs, 42.60% of vol, VWAP $0.1152, b:s 1:3.93, 20.3% buys
$0.1160-$0.1165: 414592 shrs, 31.11% of vol, VWAP $0.1162, b:s 1:2.65, 26.6% buys
$0.1175-$0.1199: 155055 shrs, 11.63% of vol, VWAP $0.1179, b:s 1:2.48, 28.7% buys
$0.1200-$0.1239: 032700 shrs, 02.45% of vol, VWAP $0.1208, b:s 1:1.92, 34.3% buys
My original experimental inflection point calculations remain in a general weakening trend and because of the simplistic nature of those original algorithms, the bullishness of today made barely a blip on the chart.
My newer version, which is also in a general down trend, and is began showing the start of a pattern I look for suggesting a substantive move lower near-term, captured today "sentiment" much more clearly. It doesn't mean bullishness is here because the pattern guides me is a long way from appearing on the upside. However, the strong start to a pattern suggesting a down move is not out of play. If the positive action of today doesn't hold that negative pattern should begin very quickly to develop again.
I'll be keeping an eye out for a hint in either direction.
OTC markets down 11/07 until ~15:00 resulting in an aberrant day! Keep that in mind when looking at numbers below!
Some day-to-day VWAP changes, with the end date shown and the percentage change from the prior day. Buy percentage is the last value on each line.
10/24 $0.1285 -02.80% 25.1%
10/25 $0.1254 -02.37% 27.8%
10/28 $0.1267 +01.00% 36.0%
10/29 $0.1274 +00.54% 55.6%
10/30 $0.1232 -03.25% 23.3%
10/31 $0.1222 -00.84% 21.2%
11/01 $0.1249 +02.20% 19.9%
11/04 $0.1289 +03.25% 33.5%
11/05 $0.1340 +03.94% 33.2%
11/06 $0.1272 -05.07% 24.3%
11/07 $0.1251 -01.68% 55.2%
11/08 $0.1229 -01.74% 38.9%
11/11 $0.1237 +00.62% 35.7%
11/12 $0.1201 -02.91% 28.3%
11/13 $0.1214 +01.07% 35.0%
11/14 $0.1139 -06.19% 31.7%
11/15 $0.1203 +05.69% 38.5%
11/18 $0.1206 +00.27% 43.5% MAN. ADJ'D. DATASET
11/19 $0.1155 -03.73% 23.6%
This week's daily estimated values (older dailys in prior EOD posts in prior instablog) for next share issue:
11/18: 20 lowest intra-day VWAPs in 40 days avg, $0.1182, x 85%: $0.1004
11/19: 20 lowest intra-day VWAPs in 40 days avg, $0.1179, x 85%: $0.1002
Vol, in K, for above days: 1373.74 and 1332.68.
Week ending summaries of PIPE financing estimated 85% share pricing, "Dly Sht % of 'sells'", and inflection points here are in the latest daily post above.
11/18/2013: EOD stuff partially copied to the concentrator.
===================== BEG ADJUSTED DATA! =====================
# Trds: 185, MinTrSz: 150, MaxTrSz: 70000, Vol: 1381235, AvTrSz: 7466
Min. Pr: 0.1160, Max Pr: 0.1250, VW Avg. Tr. Pr: 0.1200
# Buys, Shares: 86 593630, VW Avg Buy Pr: 0.1198
# Sells, Shares: 99 787005, VW Avg Sell Pr: 0.1180
# Unkn, Shares: 0 14400, VW Avg Unk. Pr: 0.1218
Buy:Sell 1:1.33 (43% "buys"), DlyShts 294250 (21.30%), Dly Sht % of 'sells' 37.39%
===================== END ADJUSTED DATA! =====================
===================== BEG SUSPECT DATA! =====================
# Trds: 183, MinTrSz: 150, MaxTrSz: 70000, Vol: 1373735, AvTrSz: 7507
Min. Pr: 0.1160, Max Pr: 0.1250, VW Avg. Tr. Pr: 0.1188
# Buys, Shares: 66 479230, VW Avg Buy Pr: 0.1200
# Sells, Shares: 97 779505, VW Avg Sell Pr: 0.1179
# Unkn, Shares: 20 115000, VW Avg Unk. Pr: 0.1192
Buy:Sell 1:1.63 (34.9% "buys"), DlyShts 294250 (21.42%), Dly Sht % of 'sells' 37.75%
===================== END SUSPECT DATA! =====================
As happened yesterday, we started strong on price and buy percentage with reasonable volume portending great things to come. As with almost every day the PIPErs spoil the party. Today was different in that there were folks putting in higher bids, including ARCA and CANT. ARCA is not often seen on the buy side, so this is automatically suspicious. CANT has only recently started leaving the comfort of their 421K $0.11 bid to get to the top of the bids (albeit only briefly every time so far), so this is also suspicious.
I'm going to let my TFH have free run here and say there's more than honest bullish sentiment going on here because neither of these two sets of "players" contest for the bid once it starts moving up a bit. They come in relatively earlier, grab a quick tea and crumpets and then disappear until price weakens again. Then they repeat the procedure.
Here's some arbitrary snapshots of ending time, buy percentage, VWAP and volume. The first three values are for the period end and the last three are cumulative.
===================== BEG ADJUSTED DATA! =====================
10:02:50 73.86% $0.1214 326680 73.86% $0.1214 0326680
11:02:57 49.81% $0.1175 294900 62.45% $0.1196 0621580
11:59:15 49.21% $0.1188 177200 59.51% $0.1194 0798780
12:58:22 13.61% $0.1177 254305 48.43% $0.1190 1053085
13:57:09 45.66% $0.1172 084650 48.22% $0.1189 1137735
14:55:23 35.71% $0.1172 070000 47.50% $0.1188 1207735
15:42:56 00.00% $0.1184 095500 44.02% $0.1187 1303235
15:59:13 28.37% $0.1194 070500 43.21% $0.1188 1373735
===================== END ADJUSTED DATA! =====================
===================== BEG SUSPECT DATA! =====================
10:02:50 73.86% $0.1214 326680 73.86% $0.1214 0326680
11:02:57 23.74% $0.1175 294900 50.08% $0.1196 0621580
11:59:15 38.60% $0.1188 177200 47.53% $0.1194 0798780
12:58:22 12.15% $0.1177 254305 38.99% $0.1190 1053085
13:57:09 33.85% $0.1172 084650 38.61% $0.1189 1137735
14:55:23 28.57% $0.1172 070000 38.02% $0.1188 1207735
15:42:56 00.00% $0.1184 095500 35.24% $0.1187 1303235
15:59:13 28.37% $0.1194 070500 34.89% $0.1188 1373735
===================== END SUSPECT DATA! =====================
On the traditional TA front we have now three of the last five closes below the support line at $0.12 and today closed at that level. Our high today pulled way back from the upper Bollinger, which it had pushed through yesterday, and pushed the high slightly above the mid-point of $0.1237 and closed below it. Price range pulled back below my long-term descending resistance (origin high of 3/5 with touches 5/31, 6/3, 6/14 and 11/15).
All the oscillators I watch, except stochastic and RSI, had a small negative reaction to the action today. For now these are just reflecting the volatility in price range and volume and carry no real meaningful indications, other than nothing is suggesting up at the moment.
As it's been doing since 11/12 volume peaked, volume continues trending lower, usually a sign of entering consolidation or a bottoming process. Volume and daily short volume continued the pattern, being down -26.50% and -45.36% respectively. This continued behavior is keeping the daily short sales percentage in the descending trend, which I believe precludes the likelihood of price rise beginning yet.
I'll skip the intra-day trading breakdown by arbitrary times-frames since the above breakdown(s) should suffice.
Here's the intra-day trading breakdown by arbitrary price range.
===================== BEG ADJUSTED DATA! =====================
$0.1160-$0.1171: 282150 shrs, 20.54% of vol, VWAP $0.1165, b:s 1:6.03, 14.2% buys
$0.1175-$0.1178: 237400 shrs, 17.28% of vol, VWAP $0.1175, b:s 1:2.22, 31.0% buys
$0.1180-$0.1189: 316585 shrs, 23.05% of vol, VWAP $0.1184, b:s 1:1.99, 33.3% buys
$0.1190-$0.1199: 296400 shrs, 21.58% of vol, VWAP $0.1195, b:s 1.95:1, 69.1% buys
$0.1200-$0.1230: 161900 shrs, 11.79% of vol, VWAP $0.1212, b:s 1.52:1, 55.9% buys
$0.1238-$0.1250: 079300 shrs, 05.77% of vol, VWAP $0.1246, 100% buys
===================== END ADJUSTED DATA! =====================
===================== BEG SUSPECT DATA! =====================
$0.1160-$0.1171: 282150 shrs, 20.54% of vol, VWAP $0.1165, b:s 1:6.88, 12.5% buys
$0.1175-$0.1178: 237400 shrs, 17.28% of vol, VWAP $0.1175, b:s 1:4.23, 16.2% buys
$0.1180-$0.1189: 316585 shrs, 23.05% of vol, VWAP $0.1184, b:s 1:2.07, 32.1% buys
$0.1190-$0.1199: 296400 shrs, 21.58% of vol, VWAP $0.1195, b:s 1.27:1, 45.3% buys
$0.1200-$0.1230: 161900 shrs, 11.79% of vol, VWAP $0.1212, b:s 1.52:1, 55.9% buys
$0.1238-$0.1250: 079300 shrs, 05.77% of vol, VWAP $0.1246, 100% buys
===================== END SUSPECT DATA! =====================
My original experimental inflection point calculations remain in a general weakening trend and because of the simplistic nature of those original algorithms, the bullishness of today made barely a blip on the chart.
My newer version, which is also in a general down trend, and is began showing the start of a pattern I look for suggesting a substantive move lower near-term, captured today "sentiment" much more clearly. It doesn't mean bullishness is here because the pattern guides me is a long way from appearing on the upside. However, the strong start to a pattern suggesting a down move is not out of play. If the positive action of today doesn't hold that negative pattern should begin very quickly to develop again.
I'll be keeping an eye out for a hint in either direction.
OTC markets down 11/07 until ~15:00 resulting in an aberrant day! Keep that in mind when looking at numbers below!
Some day-to-day VWAP changes, with the end date shown and the percentage change from the prior day. Buy percentage is the last value on each line.
10/24 $0.1285 -02.80% 25.1%
10/25 $0.1254 -02.37% 27.8%
10/28 $0.1267 +01.00% 36.0%
10/29 $0.1274 +00.54% 55.6%
10/30 $0.1232 -03.25% 23.3%
10/31 $0.1222 -00.84% 21.2%
11/01 $0.1249 +02.20% 19.9%
11/04 $0.1289 +03.25% 33.5%
11/05 $0.1340 +03.94% 33.2%
11/06 $0.1272 -05.07% 24.3%
11/07 $0.1251 -01.68% 55.2%
11/08 $0.1229 -01.74% 38.9%
11/11 $0.1237 +00.62% 35.7%
11/12 $0.1201 -02.91% 28.3%
11/13 $0.1214 +01.07% 35.0%
11/14 $0.1139 -06.19% 31.7%
11/15 $0.1203 +05.69% 38.5%
11/18 $0.1206 +00.27% 43.5% MAN. ADJ'D. DATASET
This week's daily estimated values (older dailys in prior EOD posts in prior instablog) for next share issue:
11/18: 20 lowest intra-day VWAPs in 40 days avg, $0.1182, x 85%: $0.1004
Vol, in K, for above days: 1,219.97, 2,709.29, 2,142.80, 1,827.87, 1,868.92.
Week ending summaries of PIPE financing estimated 85% share pricing, "Dly Sht % of 'sells'", and inflection points here are in the latest daily post above.
11/15/2013: EOD stuff partially copied to the concentrator.
# Trds: 185, MinTrSz: 100, MaxTrSz: 100000, Vol: 1868919, AvTrSz: 10102
Min. Pr: 0.1150, Max Pr: 0.1350, VW Avg. Tr. Pr: 0.1203
# Buys, Shares: 92 719786, VW Avg Buy Pr: 0.1225
# Sells, Shares: 92 1146883, VW Avg Sell Pr: 0.1189
# Unkn, Shares: 1 2250, VW Avg Unk. Pr: 0.1150
Buy:Sell 1:1.59 (38.5% "buys"), DlyShts 538550 (29.05%), Dly Sht % of 'sells' 46.96%
The 10-Q PR released this morning had more information in the commentary than the 10-Q released after-hours yesterday. The conference call transcript includes some good questions and discussion.
There must have been some good expectations based on the 10-Q and the PR because we started bullish trading pre-market and continued for a good part of the day in that vein.
Regardless, the PIPErs were still in evidence as the late-day weakness appeared, as usual, and converted a strong buy percentage to something more akin to recent "normal". See the discussion of it below and the intra-day trading breakdowns below.
There were two pre-market trades totaling 15K that FINRA-reported daily short sales don't include. Adding that to the FINRA trade volume raises it from 1,853,919 to my total and would lower the short percentage from 29.05% to my 28.82%. If the shares are also added to the short sales, the short volume moves from 538,550 to 553,550 and the short percentage would be 29.62%.
These trades started the day's bullish action with trade prices of 10K at $0.1150 for the first and 5K at $0.1250 for the second. How bullish was it? Through 10:23 we traded ~582.7K shares with a buy percentage of 69.93% and a VWAP of $0.1242. Here's some arbitrary snapshots of ending time, buy percentage, VWAP and volume. The first three values are for the period end and the last three are cumulative.
09:44:29 53.60% 0.1253 276300 53.60% 0.1253 0276300
09:58:38 80.55% 0.1231 190270 64.59% 0.1244 0466570
10:22:51 91.39% 0.1236 116117 69.93% 0.1242 0582687
11:03:17 24.92% 0.1245 166499 59.93% 0.1243 0749186
And we held up fairly well for three hours.
12:00:38 35.72% 0.1183 349983 52.22% 0.1224 1099169
14:00:12 53.94% 0.1195 197450 52.48% 0.1219 1296619
But as I mentioned in a comment at 13:19, I had seen signs of weakening and the last two hours were a killer (yes, 14:00-15:00 and 15:00-16:00), as usual.
15:01:22 19.96% 0.1190 187400 48.37% 0.1216 1484019
15:43:06 01.48% 0.1153 128400 44.64% 0.1211 1612419
15:59:41 00.00% 0.1157 256500 38.51% 0.1203 1868919
Of course, this doesn't mean sentiment wasn't bullish, just that the ever-present PIPErs are ever-present. So we ended with the day's VWAP and volume up +5.69% and 2.25% respectively. As I expect with strong buy percentages, the daily short volume was up 28.52% from yesterday's ~419K and the percentage was up from yesterday's 22.92% to today's 28.82%.
On the traditional TA front we have now three of the last four closes below the support line at $0.12 with four consecutive days of lower highs and one higher high now. Our high today was just below the upper Bollinger of $0.1364 and barely above my long-term descending resistance (origin high of 3/5 with touches 5/31, 6/3, 6/14 and today). I believe we can consider this a confirmed break down from our trading channel.
All the oscillators I watch, except accumulation and distribution, had a small positive reaction to the action today. To be meaningful we need to see some extended bullish behavior of sufficient duration to make these things seriously trend more positive.
I noted yesterday that volume is trending lower, usually a sign of entering consolidation or a bottoming process. Today's relatively small increase, combined with the early bullish behavior, leaves me still thinking lower is the price trend.
Yesterday I said I was reasonably certain we'd be visiting $0.10xx again because more downside was suggested by the volume over the last three days, especially with the "sells" accounting for so much, in both absolute and percentage terms: ~1.941MM, 71.7%; ~1.382MM, 64.5%; and ~1.238MM, 67.8%. Today we add sells of ~1.147MM and 61.4% to the list. When we had bullish behavior as strong as it was today and still end this way it demonstrates how strong the PIPErs (and MMs?) are, in terms of available shares to dump into the market.
I'll skip the intra-day trading breakdown by arbitrary times-frames since the above breakdown should suffice.
Here's the intra-day trading breakdown by arbitrary price range.
$0.1150-$0.1170: 590113 shrs, 31.58% of vol, VWAP $0.1156, b:s 1:7.39, 11.9% buys
$0.1175-$0.1199: 381870 shrs, 20.43% of vol, VWAP $0.1191, b:s 1:1.48, 40.3% buys
$0.1200-$0.1221: 358587 shrs, 19.19% of vol, VWAP $0.1204, b:s 1:1.01, 49.8% buys
$0.1230-$0.1260: 339200 shrs, 18.15% of vol, VWAP $0.1249, b:s 1:1.36, 42.5% buys
$0.1274-$0.1289: 138549 shrs, 07.41% of vol, VWAP $0.1278, b:s 4.33:1, 81.2% buys
$0.1290-$0.1350: 060600 shrs, 03.24% of vol, VWAP $0.1306, 100% buys
My original experimental inflection point calculations remain in a general weakening trend and because of the simplistic nature of those original algorithms, the bullishness of today made barely a blip on the chart.
My newer version, which is also in a general down trend, and is began showing the start of a pattern I look for suggesting a substantive move lower near-term, captured today "sentiment" much more clearly. It doesn't mean bullishness is here because the pattern guides me is a long way from appearing on the upside. However, the strong start to a pattern suggesting a down move is not out of play. If the positive action of today doesn't hold that negative pattern should begin very quickly to develop again.
I'll be keeping an eye out for a hint in either direction.
OTC markets down 11/07 until ~15:00 resulting in an aberrant day! Keep that in mind when looking at numbers below!
Some day-to-day VWAP changes, with the end date shown and the percentage change from the prior day. Buy percentage is the last value on each line.
10/24 $0.1285 -02.80% 25.1%
10/25 $0.1254 -02.37% 27.8%
10/28 $0.1267 +01.00% 36.0%
10/29 $0.1274 +00.54% 55.6%
10/30 $0.1232 -03.25% 23.3%
10/31 $0.1222 -00.84% 21.2%
11/01 $0.1249 +02.20% 19.9%
11/04 $0.1289 +03.25% 33.5%
11/05 $0.1340 +03.94% 33.2%
11/06 $0.1272 -05.07% 24.3%
11/07 $0.1251 -01.68% 55.2%
11/08 $0.1229 -01.74% 38.9%
11/11 $0.1237 +00.62% 35.7%
11/12 $0.1201 -02.91% 28.3%
11/13 $0.1214 +01.07% 35.0%
11/14 $0.1139 -06.19% 31.7%
11/15 $0.1203 +05.69% 38.5%
This week's daily estimated values (older dailys in prior EOD posts in prior instablog) for next share issue:
11/11: 20 lowest intra-day VWAPs in 40 days avg, $0.1193, x 85%: $0.1014
11/12: 20 lowest intra-day VWAPs in 40 days avg, $0.1191, x 85%: $0.1012
11/13: 20 lowest intra-day VWAPs in 40 days avg, $0.1189, x 85%: $0.1011
11/14: 20 lowest intra-day VWAPs in 40 days avg, $0.1185, x 85%: $0.1007
11/15: 20 lowest intra-day VWAPs in 40 days avg, $0.1183, x 85%: $0.1006
Vol, in K, for above days: 1,219.97, 2,709.29, 2,142.80, 1,827.87, 1,868.92.
Week ending summaries of PIPE financing estimated 85% share pricing, "Dly Sht % of 'sells'", and inflection points here are in the latest daily post above.
11/14/2013: EOD stuff partially copied to the concentrator.
# Trds: 176, MinTrSz: 210, MaxTrSz: 74210, Vol: 1827868, AvTrSz: 10386
Min. Pr: 0.1110, Max Pr: 0.1225, VW Avg. Tr. Pr: 0.1139
# Buys, Shares: 83 578937, VW Avg Buy Pr: 0.1141
# Sells, Shares: 91 1238931, VW Avg Sell Pr: 0.1137
# Unkn, Shares: 2 10000, VW Avg Unk. Pr: 0.1151
Buy:Sell 1:2.14 (31.7% "buys"), DlyShts 419031 (22.92%), Dly Sht % of 'sells' 33.82%
10-Q released after-hours. I suspect it'll be viewed the way I was viewing my inflection point calculations today - fairly negative as they made a strong beginning of the pattern that says down more.
Anyway, on to the daily drudgery ...
Trade volume and daily short sales were down -14.70% and -33.80% respectively, moving daily short sales down substantially from yesterday's 29.54%. This fits with my thinking as the buy percentage dropped off -9.56% from yesterday's 35%. In absolute terms, the shares "bought" dropped from yesterday's 750,409 to 578,937, a drop of -22.85%. Compare this to trade volume drop of -14.70% ...
On the traditional TA front we have a close below the support line again, again offering a chance to confirm a break down from our trading channel. In spite of the PR and decent volume we got a lower high and low. As I said yesterday, I don't think this bodes well going forward.
Recall yesterday's "... the lows came in the early trading as if some sellers didn't get the word and it took them a while to recognize that there were buyers willing to bid up. Around 11:00 ... trading left the $0.12 area and managed to get to the day's high, $0.1279 by 13:18. ... we were back down to just above $0.12 by 14:11". In contrast, today's action was straight down, as seen in the trading breakdown by arbitrary time below.
All the oscillators I watch, except stochastic, had negative moves today. Stochastic improved a small amount but is in oversold territory big-time, so don't hang a lot of hope on it yet.
Volume is trending lower, usually a sign of entering consolidation or a bottoming process. But it's still relatively quite high and I'm reading it as suggesting more downside in the cards near-term.
I'm reasonably certain we'll be visiting $0.10xx again in spite of the 421K CANT bid at $0.11 and the expected support that might be added when the usual buying, as price drops, comes in. Unless today's CC is a blockbuster, more downside is suggested by the volume over the last three days, especially with the "sells" accounting for so much, in both absolute and percentage terms: ~1.941MM, 71.7%; ~1.382MM, 64.5%; and ~1.238MM, 67.8%.
Here's the intra-day trading breakdown by arbitrary times-frames.
09:30-09:44: 141090 shrs, 07.72% of vol, VWAP $0.1201, 22.3% buys
09:45-10:13: 182315 shrs, 09.97% of vol, VWAP $0.1149, 38.8% buys
10:23-10:45: 084298 shrs, 04.61% of vol, VWAP $0.1144, 40.9% buys
10:49-11:46: 109146 shrs, 05.97% of vol, VWAP $0.1163, 38.6% buys
11:53-12:21: 218810 shrs, 11.97% of vol, VWAP $0.1140, 07.9% buys
12:29-12:59: 159236 shrs, 08.71% of vol, VWAP $0.1133, 22.6% buys
13:04-13:45: 078500 shrs, 04.29% of vol, VWAP $0.1150, 29.9% buys
13:46-14:13: 100645 shrs, 05.51% of vol, VWAP $0.1135, 15.5% buys
14:22-14:34: 088923 shrs, 04.86% of vol, VWAP $0.1127, 55.0% buys
14:34-15:03: 343200 shrs, 18.78% of vol, VWAP $0.1111, 32.5% buys
15:14-15:33: 223705 shrs, 12.24% of vol, VWAP $0.1125, 42.5% buys
15:33-15:55: 098000 shrs, 05.36% of vol, VWAP $0.1133, 53.1% buys
Here's the intra-day trading breakdown by arbitrary price range.
$0.1110-$0.1112: 324100 shrs, 17.73% of vol, VWAP $0.1111, b:s 1:2.50, 28.5% buys
$0.1120-$0.1135: 729109 shrs, 39.89% of vol, VWAP $0.1128, b:s 1:2.41, 29.3% buys
$0.1140-$0.1149: 151808 shrs, 08.31% of vol, VWAP $0.1142, b:s 1:1.11, 47.3% buys
$0.1150-$0.1151: 388615 shrs, 21.26% of vol, VWAP $0.1150, b:s 1:3.39, 22.2% buys
$0.1159-$0.1199: 097696 shrs, 05.34% of vol, VWAP $0.1167, b:s 3.88:1, 79.5% buys
$0.1200-$0.1225: 136540 shrs, 07.47% of vol, VWAP $0.1204, b:s 1:2.70, 27.1% buys
My original experimental inflection point calculations remain in a general weakening trend.
My newer version, which reflected slightly better behavior yesterday, in a general down trend, and is now showing the start of a pattern I look for suggesting a substantive move lower near-term.
OTC markets down 11/07 until ~15:00 resulting in an aberrant day! Keep that in mind when looking at numbers below!
Some day-to-day VWAP changes, with the end date shown and the percentage change from the prior day. Buy percentage is the last value on each line.
10/24 $0.1285 -02.80% 25.1%
10/25 $0.1254 -02.37% 27.8%
10/28 $0.1267 +01.00% 36.0%
10/29 $0.1274 +00.54% 55.6%
10/30 $0.1232 -03.25% 23.3%
10/31 $0.1222 -00.84% 21.2%
11/01 $0.1249 +02.20% 19.9%
11/04 $0.1289 +03.25% 33.5%
11/05 $0.1340 +03.94% 33.2%
11/06 $0.1272 -05.07% 24.3%
11/07 $0.1251 -01.68% 55.2%
11/08 $0.1229 -01.74% 38.9%
11/11 $0.1237 +00.62% 35.7%
11/12 $0.1201 -02.91% 28.3%
11/13 $0.1214 +01.07% 35.0%
11/14 $0.1139 -06.19% 31.7%
This week's daily estimated values (older dailys in prior EOD posts in prior instablog) for next share issue:
11/11: 20 lowest intra-day VWAPs in 40 days avg, $0.1193, x 85%: $0.1014
11/12: 20 lowest intra-day VWAPs in 40 days avg, $0.1191, x 85%: $0.1012
11/13: 20 lowest intra-day VWAPs in 40 days avg, $0.1189, x 85%: $0.1011
11/14: 20 lowest intra-day VWAPs in 40 days avg, $0.1185, x 85%: $0.1007
Vol, in K, for above days: 1,219.97, 2,709.29, 2,142.80, 1827.87.
Week ending summaries of PIPE financing estimated 85% share pricing, "Dly Sht % of 'sells'", and inflection points here are in the latest daily post above.
11/13/2013: EOD stuff partially copied to the concentrator.
# Trds: 193, MinTrSz: 100, MaxTrSz: 88100, Vol: 2142796, AvTrSz: 11103
Min. Pr: 0.1120, Max Pr: 0.1279, VW Avg. Tr. Pr: 0.1214
# Buys, Shares: 86 750409, VW Avg Buy Pr: 0.1225
# Sells, Shares: 106 1382837, VW Avg Sell Pr: 0.1208
# Unkn, Shares: 1 9550, VW Avg Unk. Pr: 0.1220
Buy:Sell 1:1.84 (35% "buys"), DlyShts 632986 (29.54%), Dly Sht % of 'sells' 45.77%
PR today about sale of a battery ESS for a solar application produced a nice bump up in price, as can be seen from the high today. It helped the VWAP a bit, bumping it up 1.07%. It also produced a close above the support of our sideways trading channel, preventing confirmation of a break below. Buy percentage moved back into the low end of "normal", but the weakness of it reflected the minor nature of the PR in my opinion. Other than those items, behavior was somewhat the same as we've come to expect.
Trade volume and daily short sales were down -20.91% and -8.92% respectively, producing a daily short percentage bump up from yesterday's 25.65%. If you look at the chart you see that it topped right at the descending trend line though. It's still doing what I expect when the price trend will continue lower. Maybe we'll get some additional interest from more folks in the next couple days as the news spreads a little. If so, maybe we get saved.
On the traditional TA front I already mentioned that we didn't confirm a break down from our trading channel. Unfortunately even the PR and decent volume didn't prevent a lower high and a low that matched yesterday's, $0.112. I don't think this bodes well going forward.
Possibly offsetting this, the lows came in the early trading as if some sellers didn't get the word and it took them a while to recognize that there were buyers willing to bid up. Around 11:00 it looks like awareness dawned and trading left the $0.12 area and managed to get to the day's high, $0.1279 by 13:18. But that was just the cue for the sellers to take advantage and we were back down to just above $0.12 by 14:11. I guess that was just the usual late-day weakness kicking in.
The oscillators I watch, except ADX and related, had a small positive response to today's trading action. Unfortunately the combination of slightly lower volume combined with a lower high wasn't enough to cause any of them to move above neutral. ADX and related continued to weaken. The low of yesterday and today both penetrated the lower Bollinger limit, $0.1145 today.
I mentioned yesterday a thin hope that we'd bottomed resided in the volume. With the volume of today and a positive PR not having enough effect to get a higher high, I suspect that thin hope is gone.
No trading breakdown today - I'm tired.
I discussed average trade sizes yesterday and why they are not viewed positively by me now. You can see above the average trade size is still up there in the clouds. So I figure it means the same as yesterday - no good can come of it.
I've been saying I'd not seen anything yet though that says we won't re-visit the $0.10 area. When I say the PR this morning I had hopes. After watching today's action, it's not much of a hope though. Maybe tomorrow.
My original experimental inflection point calculations continue volatile and in a general weakening trend.
My newer version responds to additional factors and reflected the slightly better behavior today. It's also been volatile, in a general down trend, and is not showing the pattern I look for suggesting a possible sustainable appreciation might be on the horizon.
OTC markets down 11/07 until ~15:00 resulting in an aberrant day! Keep that in mind when looking at numbers below!
Some day-to-day VWAP changes, with the end date shown and the percentage change from the prior day. Buy percentage is the last value on each line.
10/24 $0.1285 -02.80% 25.1%
10/25 $0.1254 -02.37% 27.8%
10/28 $0.1267 +01.00% 36.0%
10/29 $0.1274 +00.54% 55.6%
10/30 $0.1232 -03.25% 23.3%
10/31 $0.1222 -00.84% 21.2%
11/01 $0.1249 +02.20% 19.9%
11/04 $0.1289 +03.25% 33.5%
11/05 $0.1340 +03.94% 33.2%
11/06 $0.1272 -05.07% 24.3%
11/07 $0.1251 -01.68% 55.2%
11/08 $0.1229 -01.74% 38.9%
11/11 $0.1237 +00.62% 35.7%
11/12 $0.1201 -02.91% 28.3%
11/13 $0.1214 +01.07% 35.0%
This week's daily estimated values (older dailys in prior EOD posts in prior instablog) for next share issue:
11/11: 20 lowest intra-day VWAPs in 40 days avg, $0.1193, x 85%: $0.1014
11/12: 20 lowest intra-day VWAPs in 40 days avg, $0.1191, x 85%: $0.1012
11/13: 20 lowest intra-day VWAPs in 40 days avg, $0.1189, x 85%: $0.1011
Vol, in K, for above days: 1,219.97, 2,709.29, 2,142.80.
Week ending summaries of PIPE financing estimated 85% share pricing, "Dly Sht % of 'sells'", and inflection points here are in the latest daily post above.
11/12/2013: EOD stuff partially copied to the concentrator.
# Trds: 208, MinTrSz: 600, MaxTrSz: 100000, Vol: 2709292, AvTrSz: 13025
Min. Pr: 0.1120, Max Pr: 0.1310, VW Avg. Tr. Pr: 0.1201
# Buys, Shares: 64 768002, VW Avg Buy Pr: 0.1207
# Sells, Shares: 144 1941290, VW Avg Sell Pr: 0.1198
# Unkn, Shares: 0 0, VW Avg Unk. Pr: 0.0000
Buy:Sell 1:2.53 (28.3% "buys"), DlyShts 695002 (25.65%), Dly Sht % of 'sells' 35.80%
ARCA was in very early and all the usual suspects joined very aggressively on the ask, along with CANT (a few times). It's the first time I noted they were a bit more aggressive there.
The long-standing potential support at $0.12 (hit 200K+ today with ATDF kicking in 100K+) didn't hold up well - hitting the bids was just too predominate during the time the best bid was in that area.
Today could've been worse and it could've been better. Buy percentage at 10:40 on ~494.9K shares was ... 7.07%, meaning selling was ~459.9K. That could've been better. Fortunately it got better as can be seen from the EOD percentage.
VWAP was $0.1206 and could've been worse. In fact it got worse, as can bee seen by the EOD VWAP.
We never got up to $0.12 after 14:00 today. We traded somewhere in excess of 1.12MM shares, around 41% of volume, below $0.12 from 14:01 onward.
Trade volume and daily short sales were up +122.08% and +226.09% respectively. On this volume the buy volume and percentage was strong enough that this still fits the framework of my thinking about the relationship between buy percentage and daily short sales. In the trading breakdown below we can see ranges where buy percentage was quite strong with volume. Regardless, daily short sales continues within the general near-term down trend, as seen on the chart.
On the traditional TA front, it looks like we're breaking out of the sideways trading channel we've been stuck in. If we confirm today, which I do expect, we'll certainly find out just how strong the support at $0.11 is, where CANT has had a 421K bid for a long time now. If the sort volume (increases) we've been seeing holds, it could blow right by that level.
Every oscillator I watch is below neutral and Williams %R and stochastic are deep in oversold now. Momentum is down around 0.915 and ADX is near the bottom on DI+, DI- and ADX.
A thin hope that we've bottomed resides in the volume. It was large enough that traditionally it would suggest we may have bottomed. Counter to that, volume has been rising since 10/31 in a manner that makes a trend line along the tops of the volume bars easy. So today's volume didn't break that trend. I really don't have a feel for whether or not that's significant. We may need to see 3MM-4MM again to suspect the end of trend is being seen based on volume. For right now, I would hedge towards trend continuation.
"Late-day weakness" returned in spades today - look at 14:01 onward in the trading breakdown by arbitrary time.
Here's the trading breakdown by arbitrary times.
09:30-09:59: 177940 shrs, 06.57% of vol, VWAP $0.1217, 19.7% buys
10:01-10:40: 316950 shrs, 11.70% of vol, VWAP $0.1201, 00.0% buys
10:41-10:56: 110000 shrs, 04.06% of vol, VWAP $0.1213, 68.2% buys
11:00-11:30: 130409 shrs, 04.81% of vol, VWAP $0.1236, 71.2% buys
11:45-12:00: 379000 shrs, 13.99% of vol, VWAP $0.1248, 31.7% buys
12:01-12:50: 262800 shrs, 09.70% of vol, VWAP $0.1219, 16.3% buys
13:05-14:00: 215543 shrs, 07.96% of vol, VWAP $0.1206, 25.8% buys
14:01-14:59: 186800 shrs, 06.89% of vol, VWAP $0.1199, 21.4% buys
15:03-15:14: 430450 shrs, 15.89% of vol, VWAP $0.1195, 26.7% buys
15:15-15:29: 231100 shrs, 08.53% of vol, VWAP $0.1137, 06.3% buys
15:37-15:59: 268300 shrs, 09.90% of vol, VWAP $0.1146, 66.1% buys
Here's the breakdown by arbitrary price range. Note the $0.1200-$0.1215 range volume and buy percentage. If I had my TFH active I would say someone was making a determined effort to push price down by taking out those long-standing $0.12 bids. Unfortunately, my TFH's battery died as it doesn't have sufficient DCA to recharge during the lulls in demand.
$0.1120-$0.1140: 0161500 shrs, 05.96% of vol, VWAP $0.1123, b:s 0.0% buys
$0.1150-$0.1160: 0365400 shrs, 13.49% of vol, VWAP $0.1150, b:s 1:1.01, 49.8% buys
$0.1175-$0.1188: 0105500 shrs, 03.89% of vol, VWAP $0.1180, b:s 1:1.64, 37.9% buys
$0.1190-$0.1199: 0094000 shrs, 03.47% of vol, VWAP $0.1196, b:s 0.0% buys
$0.1200-$0.1215: 1325283 shrs, 48.92% of vol, VWAP $0.1204, b:s 1:5.05, 16.5% buys
$0.1220-$0.1230: 0323100 shrs, 11.93% of vol, VWAP $0.1223, b:s 1:1.43, 41.2% buys
$0.1240-$0.1250: 0208800 shrs, 07.71% of vol, VWAP $0.1247, b:s 3.40:1, 77.3% buys
$0.1275-$0.1310: 0125709 shrs, 04.64% of vol, VWAP $0.1300, b:s 1:2.82, 26.2% buys
As mentioned previously, average trade sizes have been climbing fairly radically, but can't be viewed as I used to view it - suggesting a price rise might be in the works. The depressed prices encourage large trading sizes. In support of this change in view, we see that from the low average trade sizes around 6/3 we've had a steady climb underway while price has had a steady trend lower until this last bounce off the $0.10 all-time low on 10/10. Since that time we've entered, apparently, sideways trading pattern.
Average trade size today is the highest in almost 10 months.
I've not seen anything yet though that says we won't re-visit the $0.10 area. I still believe that the prior patterns I've touched on will repeat, albeit later than expected.
My original experimental inflection point calculations, which have been very volatile, continue that with all now showing weakening, as we would expect. Of course, the long-term trend has been unmistakable but the charts really didn't add anything to what we already knew. Yesterday I said "However, the sideways move has sustained to the point that we may be seeing the start of a generalized reduction in the weakening. But it is very early, if such is happening, and I sure wouldn't bet on anything like that right now". Scratch everything but the "I sure wouldn't bet on anything like that right now".
Yesterday I said "In contrast to all that, my newer version ... result in a view contrary to what we try to read into the original squiggles. On the new version only the two shortest periods contain any hint of improvement and they are not yet trending in a way that I can infer some positive movement. The best I can get from them for now is "volatile", but still generally not positive. Ignoring "the best I can get", I'm still reading these as negative".
Today confirms that assessment and, further, they are now strongly forming a pattern that says increased weakening seems very likely.
OTC markets down 11/07 until ~15:00 resulting in an aberrant day! Keep that in mind when looking at numbers below!
Some day-to-day VWAP changes, with the end date shown and the percentage change from the prior day. Buy percentage is the last value on each line.
10/22 $0.1334 +02.74% 39.6%
10/23 $0.1322 -00.72% 31.1%
10/24 $0.1285 -02.80% 25.1%
10/25 $0.1254 -02.37% 27.8%
10/28 $0.1267 +01.00% 36.0%
10/29 $0.1274 +00.54% 55.6%
10/30 $0.1232 -03.25% 23.3%
10/31 $0.1222 -00.84% 21.2%
11/01 $0.1249 +02.20% 19.9%
11/04 $0.1289 +03.25% 33.5%
11/05 $0.1340 +03.94% 33.2%
11/06 $0.1272 -05.07% 24.3%
11/07 $0.1251 -01.68% 55.2%
11/08 $0.1229 -01.74% 38.9%
11/11 $0.1237 +00.62% 35.7%
11/12 $0.1201 -02.91% 28.3%
This week's daily estimated values (older dailys in prior EOD posts in prior instablog) for next share issue:
11/11: 20 lowest intra-day VWAPs in 40 days avg, $0.1193, x 85%: $0.1014
11/12: 20 lowest intra-day VWAPs in 40 days avg, $0.1191, x 85%: $0.1012
Vol, in K, for above days: 1,219.97, 2,709.29.
Week ending summaries of PIPE financing estimated 85% share pricing, "Dly Sht % of 'sells'", and inflection points here are in the latest daily post above.
11/11/2013: EOD stuff partially copied to the concentrator.
# Trds: 131, MinTrSz: 375, MaxTrSz: 65100, Vol: 1219966, AvTrSz: 9313
Min. Pr: 0.1203, Max Pr: 0.1350, VW Avg. Tr. Pr: 0.1237
# Buys, Shares: 59 435771, VW Avg Buy Pr: 0.1243
# Sells, Shares: 70 774195, VW Avg Sell Pr: 0.1233
# Unkn, Shares: 2 10000, VW Avg Unk. Pr: 0.1230
Buy:Sell 1:1.78 (35.7% "buys"), DlyShts 213133 (17.47%), Dly Sht % of 'sells' 27.53%
Trade volume and daily short sales were down -38.81% and -65.26% respectively. This fits with my thinking as buy percentage was weaker than yesterday's 38.9%. However, it at least remained in the lower end of reasonable range as the typical buying on weakness came in. You can see from the daily short percentage we've continued the recently resumed trend down in this metric. I don't see price appreciation while this continues.
On the traditional TA front, no change worth noting - still weakening on all the oscillators I watch, except ADX and related, with stochastic, money flow and Williams %R in oversold territory. RSI, momentum and MFI are hovering just below neutral with MFI weakening rapidly. The MACD and its histogram have gone flat right around neutral.
On my experimental stuff, nothing much worth talking about. Normal variability with no clear trend on the experimental inflection point calculations. Average buy percentages seem to be coming together in the lower range of normal around the low 3x%: 34.07%, 34.68%, 30.25% and 33.49% for the 10, 25, 50 and 100-day averages respectively. I suspect it won't hold steady though.
ARCA showed up at 9:51 and didn't exhibit the peek-a-boo behavior. They tussled through the morning with ATDF mostly. BTIG, CSTI and CDEL contested for the lowest offer at various times throughout the day. NITE joined the festivities at 15:30 when the price rebounded to $0.1245 from the earlier lows (see price breakdowns below).
As seen a couple times recently, we had a lack of "late-day weakness", but I hesitate to call it strength. I'll settle for "reduced anemia" to describe a small recovery from very weak intra-day prices.
Here's the trading breakdown by arbitrary times. Note the strong numbers in the first line and what happens, and when, subsequently.
09:30-10:10: 086245 shrs, 07.07% of vol, VWAP $0.1264, 23.0% buys
10:17-10:25: 170050 shrs, 13.94% of vol, VWAP $0.1210, 22.8% buys
10:30-11:34: 103950 shrs, 08.52% of vol, VWAP $0.1230, 75.9% buys
11:35-11:38: 195975 shrs, 16.06% of vol, VWAP $0.1300, 37.0% buys
11:42-11:51: 039400 shrs, 03.23% of vol, VWAP $0.1217, 43.1% buys
11:55-12:51: 077700 shrs, 06.37% of vol, VWAP $0.1234, 44.7% buys
12:57-13:58: 153600 shrs, 12.59% of vol, VWAP $0.1217, 32.6% buys
14:04-14:42: 138600 shrs, 11.36% of vol, VWAP $0.1218, 61.8% buys
14:45-15:29: 043333 shrs, 03.55% of vol, VWAP $0.1226, 19.2% buys
15:31-15:47: 024113 shrs, 01.98% of vol, VWAP $0.1229, 25.4% buys
15:51-15:59: 187000 shrs, 15.33% of vol, VWAP $0.1224, 12.8% buys
Here's the breakdown by arbitrary price range. Note where the buy:sell is at in various ranges in conjunction with day's volume percentages.
$0.1203-$0.1205: 077500 shrs, 06.35% of vol, VWAP $0.1204, b:s 1:2.10, 32.3% buys
$0.1210-$0.1214: 189100 shrs, 15.50% of vol, VWAP $0.1211, b:s , 0.0% buys
$0.1220-$0.1222: 393750 shrs, 32.28% of vol, VWAP $0.1221, b:s 1:1.59, 38.6% buys
$0.1225-$0.1229: 074000 shrs, 06.07% of vol, VWAP $0.1226, b:s 1:6.40, 13.5% buys
$0.1230-$0.1235: 157983 shrs, 12.95% of vol, VWAP $0.1231, b:s 3.00:1, 70.2% buys
$0.1240-$0.1250: 108313 shrs, 08.88% of vol, VWAP $0.1247, b:s 1:1.65, 37.7% buys
$0.1269-$0.1298: 090500 shrs, 07.42% of vol, VWAP $0.1287, b:s 5.51:1, 84.6% buys
$0.1300-$0.1350: 128820 shrs, 10.56% of vol, VWAP $0.1311, b:s 1:5.32, 15.8% buys
On my blog charts, it looks for the moment like our buy percentage is trying to stabilize around the low-30% area as the averages are converging there: 34.10%, 34.46%, 30.17%, 33.37% for the 10, 25, 50 and 100-day averages respectively.
The average trade sizes have been climbing fairly radically, but it can't be viewed as I used to view it - suggesting a price rise might be in the works. As mentioned in the past, these depressed prices encourage large trading sizes. In support of this break from past behavior we see that from the low average trade sizes around 6/3 we've had a steady climb underway while price has had a steady trend lower until this last bounce of the $0.10 all-time low on 10/10. Since that time we've entered, apparently, sideways trading pattern.
I've not seen anything yet though that says we won't re-visit the $0.10 area. I still believe that the prior patterns I've touched on will repeat, albeit later than expected.
Right now, based on the concentrators' comments, it looks like hope for significant announcements next week and some possible paid pumps that made it to the likes of the WSJ are supporting price and deferring the repetition of the pattern(s).
If there is substantive news about projects and sales in the next quarterly report and/or conference call, the pattern may not repeat if the resulting bullish reaction can sustain through March next.
On my original inflection point calculations we are seeing the effects of this extended sideways movement within a channel. No solid short-term trend can get established and only the longer-term trend of weakening is observable. However, the sideways move has sustained to the point that we may be seeing the start of a generalized reduction in the weakening. But it is very early, if such is happening, and I sure wouldn't bet on anything like that right now.
Keep in mind though that those react only to volume and buy:sell ratios. So the simplistic algorithms are easily misled.
In contrast to all that, my newer version has some other factors included and they result in a view contrary to what we try to read into the original squiggles. On the new version only the two shortest periods contain any hint of improvement and they are not yet trending in a way that I can infer some positive movement. The best I can get from them for now is "volatile", but still generally not positive. Ignoring "the best I can get", I'm still reading these as negative.
On the traditional TA front, we are testing the support of our sideways channel for the third time now. This time is concerning because volume has been increasing substantially as price has been dropping (VWAPs: $0.1222, $0.1249, $0.1289, $0.1340, $0.1272, $0.1251 and $0.1229) on the down leg since we bumped resistance, ~$0.14, on 11/4-5. During the approach to the prior testing of this support we did not have either the same large volume nor a trend of increasing volume. We also have the highs trending lower while the lows are trending lower as well (but I guess that's what we'd expect in a "leg down" within the channel). All the oscillators I watch are trending down but for momentum which is trying to stabilize. Most are below neutral and a couple are ready to enter oversold again. The Bollinger limits are converging and the close was below the mid-point of ~$0.125, as was my VWAP.
OTC markets down 11/07 until ~15:00 resulting in an aberrant day! Keep that in mind when looking at numbers below!
Some day-to-day VWAP changes, with the end date shown and the percentage change from the prior day. Buy percentage is the last value on each line.
10/22 $0.1334 +02.74% 39.6%
10/23 $0.1322 -00.72% 31.1%
10/24 $0.1285 -02.80% 25.1%
10/25 $0.1254 -02.37% 27.8%
10/28 $0.1267 +01.00% 36.0%
10/29 $0.1274 +00.54% 55.6%
10/30 $0.1232 -03.25% 23.3%
10/31 $0.1222 -00.84% 21.2%
11/01 $0.1249 +02.20% 19.9%
11/04 $0.1289 +03.25% 33.5%
11/05 $0.1340 +03.94% 33.2%
11/06 $0.1272 -05.07% 24.3%
11/07 $0.1251 -01.68% 55.2%
11/08 $0.1229 -01.74% 38.9%
11/11 $0.1237 +00.62% 35.7%
This week's daily estimated values (older dailys in prior EOD posts in prior instablog) for next share issue:
11/11: 20 lowest intra-day VWAPs in 40 days avg, $0.1193, x 85%: $0.1014
Vol, in K, for above days: 1,219.97.
Week ending summaries of PIPE financing estimated 85% share pricing, "Dly Sht % of 'sells'", and inflection points here are in the latest daily post above.
11/08/2013: EOD stuff partially copied to the concentrator.
# Trds: 164, MinTrSz: 100, MaxTrSz: 68000, Vol: 1993612, AvTrSz: 12156
Min. Pr: 0.1200, Max Pr: 0.1300, VW Avg. Tr. Pr: 0.1229
# Buys, Shares: 71 776241, VW Avg Buy Pr: 0.1236
# Sells, Shares: 92 1212371, VW Avg Sell Pr: 0.1225
# Unkn, Shares: 1 5000, VW Avg Unk. Pr: 0.1215
Buy:Sell 1:1.56 (38.9% "buys"), DlyShts 613441 (30.77%), Dly Sht % of 'sells' 50.60%
As suggested by the ~40% of trade volume and strong buys percentage through 11:42 seen in the trading breakdown by time, the daily short sales came in near the high end of the recent trend range, more clearly seen on the blog charts. Comparing today against 11/06, because 11/07 OTC was down most of the day, the trade volume was up +35.50% while daily short sales were up +76.33%, more than double the trade volume percentage increase.
As a side note, somewhat supporting this sort of assessment, if for each time-frame through 11:42 you total the shares matching the buy percentage it yields ~776,156 shares, reasonably close to the FINRA-reported daily short sales of 613,441. The difference likely resides in some percentage being intra-broker trades and maybe some small long position(s) in a market-maker's portfolio. These last two sorts of trades would not require a short sale flag. Keep in mind I suspect this sort of approximation only holds strongly on "high volume, high buy percentage" days.
"Cherry picking!" you say? Why through 11:42? Simple. The combination of the generally highest prices, volume and buy percentage. It's this combination that my digging and thinking have suggested is most likely to yield high daily short sales volumes. Don't ask me why - I've expounded on various possibilities in past blogs. The long and the short of it is we may never know for sure "why", but we're getting a lot of supporting evidence for "what".
If I take the inverse of buy percentage, sells percentage, it yields ~1055455, a figure much further from the FINRA-reported figure.
It's likely there's some short sales on both "buys" and "sells" but it seems likely high-volume days with high percentage of buys are more likely to yield high daily short sales, based in the above example and my long attempts to understand how this rigged market works for us. The market-maker would not want to generally short to the bid price unless there is a sell order backing the quantity of shares being shorted. It would go counter to a "sell high and then buy low" strategy.
ARCA was in all day but again playing peek-a-boo most of the early part of the day. NITE filled in to drive asks lower with several short-term smaller-quantity offers below (well-below in four instances) the next-lowest prevailing offer at the time. Of course, the usual suspects also chipped in here and there - ATDF, BTIG, CDEL and PERT contributed too.
All this resulted in another occurrence of something we saw on 11/04 - "late-day strength". It's making me wonder if they've caught on to the fact that we'd caught on to the fact that they (were) holding price high early and then capitulating later in the day. Of course there's really was not all that much "strength" to the "late-day strength" though, unlike 11/04's occurrence (good volume and price). Today it just made price come off the absurdly low levels seen earlier in the day, although at least it did have some reasonable volume. As is usual, most of the buying came in while the prices were in the dumpster, as can be seen in the trading breakdowns that follow. This tells you how aggressively the sellers (whomever they may be) are contending to get rid of shares.
Here's the trading breakdown by arbitrary times. Note the strong numbers in the first line and what happens, and when, subsequently.
09:30-09:59: 530962 shrs, 26.63% of vol, VWAP $0.1260, 43.3% buys
10:01-10:28: 087500 shrs, 04.39% of vol, VWAP $0.1223, 11.4% buys
10:49-10:59: 088500 shrs, 04.44% of vol, VWAP $0.1228, 71.8% buys
11:08-11:42: 095000 shrs, 04.77% of vol, VWAP $0.1233, 68.4% buys
11:54-11:59: 162000 shrs, 08.13% of vol, VWAP $0.1215, 00.0% buys
12:00-12:45: 143550 shrs, 07.20% of vol, VWAP $0.1210, 50.5% buys
13:25-13:39: 114100 shrs, 05.72% of vol, VWAP $0.1210, 15.0% buys
14:22-14:59: 044400 shrs, 02.23% of vol, VWAP $0.1214, 98.0% buys
15:00-15:23: 321100 shrs, 16.11% of vol, VWAP $0.1208, 19.0% buys
15:31-15:42: 202000 shrs, 10.13% of vol, VWAP $0.1231, 68.6% buys
15:46-15:59: 204500 shrs, 10.26% of vol, VWAP $0.1220, 36.7% buys
Here's the breakdown by arbitrary price range. Note where the buy:sell is at in various ranges in conjunction with day's volume percentages.
$0.1200-$0.1208: 310533 shrs, 15.58% of vol, VWAP $0.1204, b:s 1:2.81, 26.2% buys
$0.1210-$0.1215: 482467 shrs, 24.20% of vol, VWAP $0.1211, b:s 1:2.06, 32.3% buys
$0.1220-$0.1225: 376150 shrs, 18.87% of vol, VWAP $0.1221, b:s 1:3.31, 23.2% buys
$0.1226-$0.1239: 234300 shrs, 11.75% of vol, VWAP $0.1230, b:s 1.37:1, 57.7% buys
$0.1240-$0.1261: 314962 shrs, 15.80% of vol, VWAP $0.1246, b:s 1.84:1, 64.8% buys
$0.1265-$0.1300: 275200 shrs, 13.80% of vol, VWAP $0.1281, b:s 1:1.46, 40.7% buys
On my blog charts, it looks for the moment like our buy percentage is trying to stabilize around the low-30% area as the averages are converging there: 34.10%, 34.46%, 30.17%, 33.37% for the 10, 25, 50 and 100-day averages respectively.
The average trade sizes have been climbing fairly radically, but it can't be viewed as I used to view it - suggesting a price rise might be in the works. As mentioned in the past, these depressed prices encourage large trading sizes. In support of this break from past behavior we see that from the low average trade sizes around 6/3 we've had a steady climb underway while price has had a steady trend lower until this last bounce of the $0.10 all-time low on 10/10. Since that time we've entered, apparently, sideways trading pattern.
I've not seen anything yet though that says we won't re-visit the $0.10 area. I still believe that the prior patterns I've touched on will repeat, albeit later than expected.
Right now, based on the concentrators' comments, it looks like hope for significant announcements next week and some possible paid pumps that made it to the likes of the WSJ are supporting price and deferring the repetition of the pattern(s).
If there is substantive news about projects and sales in the next quarterly report and/or conference call, the pattern may not repeat if the resulting bullish reaction can sustain through March next.
On my original inflection point calculations we are seeing the effects of this extended sideways movement within a channel. No solid short-term trend can get established and only the longer-term trend of weakening is observable. However, the sideways move has sustained to the point that we may be seeing the start of a generalized reduction in the weakening. But it is very early, if such is happening, and I sure wouldn't bet on anything like that right now.
Keep in mind though that those react only to volume and buy:sell ratios. So the simplistic algorithms are easily misled.
In contrast to all that, my newer version has some other factors included and they result in a view contrary to what we try to read into the original squiggles. On the new version only the two shortest periods contain any hint of improvement and they are not yet trending in a way that I can infer some positive movement. The best I can get from them for now is "volatile", but still generally not positive. Ignoring "the best I can get", I'm still reading these as negative.
On the traditional TA front, we are testing the support of our sideways channel for the third time now. This time is concerning because volume has been increasing substantially as price has been dropping (VWAPs: $0.1222, $0.1249, $0.1289, $0.1340, $0.1272, $0.1251 and $0.1229) on the down leg since we bumped resistance, ~$0.14, on 11/4-5. During the approach to the prior testing of this support we did not have either the same large volume nor a trend of increasing volume. We also have the highs trending lower while the lows are trending lower as well (but I guess that's what we'd expect in a "leg down" within the channel). All the oscillators I watch are trending down but for momentum which is trying to stabilize. Most are below neutral and a couple are ready to enter oversold again. The Bollinger limits are converging and the close was below the mid-point of ~$0.125, as was my VWAP.
OTC markets down 11/07 until ~15:00 resulting in an aberrant day! Keep that in mind when looking at numbers below!
Some day-to-day VWAP changes, with the end date shown and the percentage change from the prior day. Buy percentage is the last value on each line.
10/22 $0.1334 +02.74% 39.6%
10/23 $0.1322 -00.72% 31.1%
10/24 $0.1285 -02.80% 25.1%
10/25 $0.1254 -02.37% 27.8%
10/28 $0.1267 +01.00% 36.0%
10/29 $0.1274 +00.54% 55.6%
10/30 $0.1232 -03.25% 23.3%
10/31 $0.1222 -00.84% 21.2%
11/01 $0.1249 +02.20% 19.9%
11/04 $0.1289 +03.25% 33.5%
11/05 $0.1340 +03.94% 33.2%
11/06 $0.1272 -05.07% 24.3%
11/07 $0.1251 -01.68% 55.2%
11/08 $0.1229 -01.74% 38.9%
This week's daily estimated values (older dailys in prior EOD posts in prior instablog) for next share issue:
11/04: 20 lowest intra-day VWAPs in 40 days avg, $0.1195, x 85%: $0.1015
11/05: 20 lowest intra-day VWAPs in 40 days avg, $0.1195, x 85%: $0.1015
11/06: 20 lowest intra-day VWAPs in 40 days avg, $0.1195, x 85%: $0.1015
11/07: 20 lowest intra-day VWAPs in 40 days avg, $0.1195, x 85%: $0.1015
11/08: 20 lowest intra-day VWAPs in 40 days avg, $0.1193, x 85%: $0.1014
Vol, in K, for above days: 1,643.90, 1,337.91, 1,471.26, 369.75, 1,993.61.
Week ending summaries of PIPE financing estimated 85% share pricing, "Dly Sht % of 'sells'", and inflection points here are in the latest daily post above.
11/07/2013: EOD stuff partially copied to the concentrator.
OTC markets down 11/07 until ~15:00 resulting in an aberrant day!
# Trds: 51, MinTrSz: 500, MaxTrSz: 50000, Vol: 369750, AvTrSz: 7250
Min. Pr: 0.1210, Max Pr: 0.1300, VW Avg. Tr. Pr: 0.1251
# Buys, Shares: 25 203950, VW Avg Buy Pr: 0.1260
# Sells, Shares: 26 165800, VW Avg Sell Pr: 0.1239
# Unkn, Shares: 0 0, VW Avg Unk. Pr: 0.0000
Buy:Sell 1.23:1 (55.2% "buys"), DlyShts 74900 (20.26%), Dly Sht % of 'sells' 45.17%
The OTC issues makes any commentary today a waste, IMO, so none today - just numbers.
Some day-to-day VWAP changes, with the end date shown and the percentage change from the prior day. Buy percentage is the last value on each line.
10/22 $0.1334 +02.74% 39.6%
10/23 $0.1322 -00.72% 31.1%
10/24 $0.1285 -02.80% 25.1%
10/25 $0.1254 -02.37% 27.8%
10/28 $0.1267 +01.00% 36.0%
10/29 $0.1274 +00.54% 55.6%
10/30 $0.1232 -03.25% 23.3%
10/31 $0.1222 -00.84% 21.2%
11/01 $0.1249 +02.20% 19.9%
11/04 $0.1289 +03.25% 33.5%
11/05 $0.1340 +03.94% 33.2%
11/06 $0.1272 -05.07% 24.3%
11/07 $0.1251 -01.68% 55.2%
This week's daily estimated values (older dailys in prior EOD posts in prior instablog) for next share issue:
11/04: 20 lowest intra-day VWAPs in 40 days avg, $0.1195, x 85%: $0.1015
11/05: 20 lowest intra-day VWAPs in 40 days avg, $0.1195, x 85%: $0.1015
11/06: 20 lowest intra-day VWAPs in 40 days avg, $0.1195, x 85%: $0.1015
11/07: 20 lowest intra-day VWAPs in 40 days avg, $0.1195, x 85%: $0.1015
Vol, in K, for above days: 1,643.90, 1,337.91, 1,471.26, 369.75.
Week ending summaries of PIPE financing estimated 85% share pricing, "Dly Sht % of 'sells'", and inflection points here are in the latest daily post above.
11/06/2013: EOD stuff partially copied to the concentrator.
# Trds: 146, MinTrSz: 222, MaxTrSz: 85000, Vol: 1471255, AvTrSz: 10077
Min. Pr: 0.1210, Max Pr: 0.1335, VW Avg. Tr. Pr: 0.1272
# Buys, Shares: 45 357255, VW Avg Buy Pr: 0.1282
# Sells, Shares: 100 1109000, VW Avg Sell Pr: 0.1269
# Unkn, Shares: 1 5000, VW Avg Unk. Pr: 0.1300
Buy:Sell 1:3.10 (24.3% "buys"), DlyShts 347896 (23.65%), Dly Sht % of 'sells' 31.37%
Some day-to-day VWAP changes, with the end date shown and the percentage change from the prior day. Buy percentage is the last value on each line.
10/22 $0.1334 +02.74% 39.6%
10/23 $0.1322 -00.72% 31.1%
10/24 $0.1285 -02.80% 25.1%
10/25 $0.1254 -02.37% 27.8%
10/28 $0.1267 +01.00% 36.0%
10/29 $0.1274 +00.54% 55.6%
10/30 $0.1232 -03.25% 23.3%
10/31 $0.1222 -00.84% 21.2%
11/01 $0.1249 +02.20% 19.9%
11/04 $0.1289 +03.25% 33.5%
11/05 $0.1340 +03.94% 33.2%
11/06 $0.1272 -05.07% 24.3%
This week's daily estimated values (older dailys in prior EOD posts in prior instablog) for next share issue:
11/04: 20 lowest intra-day VWAPs in 40 days avg, $0.1195, x 85%: $0.1015
11/05: 20 lowest intra-day VWAPs in 40 days avg, $0.1195, x 85%: $0.1015
11/06: 20 lowest intra-day VWAPs in 40 days avg, $0.1195, x 85%: $0.1015
Late-day weakness showed big-time today. Check the trading breakdown by time here.
09:30-09:53: 075600 shrs, 05.14% of vol, VWAP $0.1298, 47.1% buys
10:01-10:27: 269200 shrs, 18.30% of vol, VWAP $0.1295, 28.2% buys
10:37-10:50: 056000 shrs, 03.81% of vol, VWAP $0.1294, 17.9% buys
11:07-11:41: 133722 shrs, 09.09% of vol, VWAP $0.1303, 30.1% buys
12:05-12:27: 064000 shrs, 04.35% of vol, VWAP $0.1305, 21.9% buys
12:52-12:55: 090000 shrs, 06.12% of vol, VWAP $0.1296, 00.0% buys
13:10-13:26: 136500 shrs, 09.28% of vol, VWAP $0.1273, 16.5% buys
13:44-13:52: 077000 shrs, 05.23% of vol, VWAP $0.1258, 13.0% buys
14:04-14:28: 033672 shrs, 02.29% of vol, VWAP $0.1273, 65.8% buys
14:35-14:55: 012561 shrs, 00.85% of vol, VWAP $0.1278, 92.0% buys
15:07-15:30: 058300 shrs, 03.96% of vol, VWAP $0.1257, 57.1% buys
15:43-15:48: 209200 shrs, 14.22% of vol, VWAP $0.1250, 06.7% buys
15:48-15:59: 255500 shrs, 17.37% of vol, VWAP $0.1228, 26.6% buys
Looking at the trading by arbitrary price range, note where the volumes and came in and what the buy percentages are - a good indicator of the selling pressure as well as buying sentiment (low prices are attractive).
$0.1210-$0.1230: 205000 shrs, 13.93% of vol, VWAP $0.1222, b:s 1:10.71, 8.5% buys
$0.1245-$0.1250: 247200 shrs, 16.80% of vol, VWAP $0.1249, b:s 1:2.99, 25.1% buys
$0.1251-$0.1265: 218800 shrs, 14.87% of vol, VWAP $0.1256, b:s 1:4.05, 19.8% buys
$0.1270-$0.1289: 057733 shrs, 03.92% of vol, VWAP $0.1278, b:s 100% buys
$0.1290-$0.1296: 366641 shrs, 24.92% of vol, VWAP $0.1292, b:s 1:8.32, 10.7% buys
$0.1300-$0.1335: 375881 shrs, 25.55% of vol, VWAP $0.1304, b:s 1:1.70, 36.5% buys
Recall that yesterday we had a move up, around 59% increase IIRC, in the daily short sales, which was predicted by the decent volume and a second day of decent buy percentage (recall that we were about 50/50 split for most of the day). Well, today we had the opposite - a big sell imbalance through most of the day until the sellers dropped price enough to entice buyers into acting. So we see the daily short sales percentage dropped from yesterday's ~33%. The percentage dropped to -23.65%. Trade and daily short sales volume changed +9.97% and -21.61% respectively.
Matching this, VWAP behaved as we would expect - down -5.07%.
ARCA was in from the get-go again, and again played peek-a-boo all day long. Unlike yesterday, they didn't exhibit behavior I thought might indicate they didn't want to push price too hard. It wouldn't have helped anyway - NITE, BTIG, ATDF and even PERT and CANT joined in the festivities. BTW, I noted in a comment earlier in the day the 421K $0.11 bid by CANT that had been lurking was nowhere to be found today. They had a 50K bid at $0.11 in for a while though. I guess it tells us something that when price started moving that direction they withdrew the apparent "supporting bid" that might have supported price.
My original inflection point calculations continue saying weakening. All but the 10-day period are in agreement. The 10-day will likely capitulate tomorrow.
The newer version now agrees 100%, but for the 10-day which has capitulated and agrees with the other periods.
Recently I mentioned the newer 5 and 10-day calculations were suggesting weakness ahead of the longer periods and said if they are more reliable I've got to believe they are leading the longer periods. If we get another day like today, I believe their better reliability is confirmed.
Looking at some traditional TA indications, we overlapped the 50-day SMA, $0.1241, again. We had a lower low and high too - $0.1210 and $0.1335. We closed below the mid-point of the Bollinger band, $0.125, at $0.122. We have begun to recede from the price-point resistance at ~$0.14 we were unable to penetrate the last two days. We had rising volume on a down day - ~1.338MM yesterday vs. today's ~1.471MM (+9.97%). Every oscillator I watch is weakening and a few, RSI, momentum and stochastic, are below neutral readings. Williams %R has entered oversold.
The long-term descending resistance which might have come into play apparently won't be a factor for a while with the price pullback today. It's origin is the high of 3/5 and has subsequent touches at the highs of 5/31, 6/3 and 6/14. Multiple touches confirms it as a possible significant trend line. Yesterday I said it should hit $0.14 in two days. It was sitting at ~$0.1428 and is now ~$0.141 AFAICT.
I'd mentioned we'd broken our descending pattern (either a wedge or channel - can't tell yet) and it was possible we're entering a sideways consolidation again. We still can't tell but if we don't break back into the $0.11 area, my best guess would be a channel with support at $0.12. I don't consider this likely with all the indicators being what they are.
But I've been wrong so far on how long this trading around the 50-day SMA might last, so consider that.
Vol, in K, for above days: 1,643.90, 1,337.91, 1,471.26.
Week ending summaries of PIPE financing estimated 85% share pricing, "Dly Sht % of 'sells'", and inflection points here are in the latest daily post above.
11/05/2013: EOD stuff partially copied to the concentrator.
# Trds: 159, MinTrSz: 200, MaxTrSz: 80000, Vol: 1337910, AvTrSz: 8415
Min. Pr: 0.1252, Max Pr: 0.1399, VW Avg. Tr. Pr: 0.1340
# Buys, Shares: 59 443710, VW Avg Buy Pr: 0.1346
# Sells, Shares: 98 894200, VW Avg Sell Pr: 0.1331
# Unkn, Shares: 2 4000, VW Avg Unk. Pr: 0.1345
Buy:Sell 1:2.02 (33.2% "buys"), DlyShts 443810 (33.17%) Dly Sht % of 'sells' 49.63%
There was one AH trade of 50K that FINRA-reported daily short sales don't include. Adding that to the FINRA trade volume raises it from 1,287,910 to my total and would lower the short percentage from 34.46% to my 33.17%. If the shares are also added to the short sales, the short volume moves from 443,810 to 493,810 and the short percentage would be 36.91%.
I had mentioned in a comment today that we should have higher daily short sales today unless we get "late-day weakness". We didn't get much of it and while trade volume was down -18.61% daily short sales, excluding the 50K AH trade, was up +29.63%. So we get the short percentage up from Monday's 20.83% by 59.28%.
This wasn't hard to predict though: for a large part of the day we had a near-50% buy:sell split and, as I've mentioned, a higher buy ratio generally portends a higher daily short sale volume and percentage, unless trade volume skyrockets, which would keep the short sales percentage lower.
I'll tell ya - someone mentioned the possibility of paid pump articles and it looks like it's PIPErs' money well-spent - at least one laudatory article didn't even mention the PIPE financing and resulting dilution. When these new buyers catch on, there might be some kind of adverse response. For now, it's apparently the PIPEr version of "supporting share price" ... so they can garner even more profit.
Assuming a $0.1018 price to them they're taking a nice quick and fat ~27% over the last three days. If it's $0.1015 to them, it's a fat ~27.4%.
And the market-makers do well too - lots of transaction fees plus whatever they scarf from a short "sell high and then buy low" to cover strategy. I wonder who doesn't make out on this deal. I'll give you three guesses and, as my dad used to say, the first two don't count.
With the trade volume down and daily short sales up, we have a resulting daily short sales percentage in the "normal" area. But if volume continues to fall, and substantially, we'll also see the buy percentage plummet from the last two days' 33.x% area. BTW, this percentage is not indicative of strength. It's just in the middle or lower range of "normal". As I mentioned before when the "pop" began, I didn't believe because buy percentage was weak, relative to other moves up.
Speaking of price, we traded completely above the 50-day SMA, $0.1243 as of EOD. But for the second consecutive day we peaked right at a price resistance line I've previously mentioned. If we can't break through that with the volume we've had, it bodes ill going forward - maybe after the pump articles stop coming?
Our two consecutive days with strengthening volume on an improved VWAP has ended. Combined with being topped-out right at a price resistance line (which goes back to 6/26's low and touches several places, including the top of our sideways trading 8/23-9/10), I can't say it looks like a move up is in the works. Of course, if volume comes back we can still break above that resistance.
ARCA was in from the get-go and played peek-a-boo all day long. I guess they didn't want to tamp price down too soon.
My original inflection point calculations continue saying weakening, with only the 10-day, and now 25-day, having a minor disagreement. Since we only got them all in agreement a few days ago, it's not unusual to have one or more show minor disagreement as older values fall out of the window. Since the 5, 50, 100 and 200-day periods all show increasing weakness, I'm believing them - especially since the five-day gave us a heads-up several days back and hasn't changed it's attitude. In fact it's showing increasing weakness for three consecutive days now.
The newer version still disagrees to some extent. The 5-day continues to roll over and suggest increasing weakness while the other periods suggest weakening is lessening.
Over the last couple days I mentioned the 5 and 10-day calculations were suggesting weakness ahead of the longer periods and said "If my newer version is more reliable, I've got to believe the 5 and 10-day calculations are leading the longer periods" and then "The proof will be in the pudding - will today retreat from yesterday's strengthening price and volume or continue upward? I don't know".
Well, now we know ... not much more. Trade volume was down -18.61% and for the second consecutive day we peaked right at a price resistance line I had mentioned. But VWAP was up 3.94%. So another day must pass before I can tell (or guess if) these calculations are really useful in this environment, or maybe in such a short time-frame.
On the traditional TA front, in addition to price topped-out right at a price resistance line, detailed above, there's a long-term descending resistance which may come into play. It's origin is the high of 3/5 and has subsequent touches at the highs of 5/31, 6/3 and 6/14. Multiple touches confirms it as a possible significant trend line. It's currently sitting at $0.1428 and should hit $0.14 in two days.
Close and high remain pretty much at the upper Bollinger limit and the "Gravestone Doji" appears to have failed - no reversal after two subsequent trading days. And I missed guessing it would be right because we had other factors that suggested down was likely.
I'd mentioned we'd broken our descending pattern (either a wedge or channel - can't tell yet) and it was possible we're entering a sideways consolidation again. The pattern of highs and lows since we bottomed in the $0.10xx range suggests this is possible, maybe even likely. Today seems to reinforce that assessment, but it is quite long in the tooth. Whether the current PIPEr environment, and pumps(?), can keep it going a lot longer is something I have no basis to guess at.
Some day-to-day VWAP changes, with the end date shown and the percentage change from the prior day. Buy percentage is the last value on each line.
10/22 $0.1334 +02.74% 39.6%
10/23 $0.1322 -00.72% 31.1%
10/24 $0.1285 -02.80% 25.1%
10/25 $0.1254 -02.37% 27.8%
10/28 $0.1267 +01.00% 36.0%
10/29 $0.1274 +00.54% 55.6%
10/30 $0.1232 -03.25% 23.3%
10/31 $0.1222 -00.84% 21.2%
11/01 $0.1249 +02.20% 19.9%
11/04 $0.1289 +03.25% 33.5%
11/05 $0.1340 +03.94% 33.2%
This week's daily estimated values (older dailys in prior EOD posts in prior instablog) for next share issue:
11/04: 20 lowest intra-day VWAPs in 40 days avg, $0.1195, x 85%: $0.1015
11/05: 20 lowest intra-day VWAPs in 40 days avg, $0.1195, x 85%: $0.1015
Vol, in K, for above days: 1,643.90, 1,337.91.
Week ending summaries of PIPE financing estimated 85% share pricing, "Dly Sht % of 'sells'", and inflection points here are in the latest daily post above.
11/04/2013: EOD stuff partially copied to the concentrator.
# Trds: 160, MinTrSz: 146, MaxTrSz: 55000, Vol: 1643903, AvTrSz: 10274
Min. Pr: 0.1203, Max Pr: 0.1400, VW Avg. Tr. Pr: 0.1289
# Buys, Shares: 56 551208, VW Avg Buy Pr: 0.1266
# Sells, Shares: 104 1147695, VW Avg Sell Pr: 0.1239
# Unkn, Shares: 0 0, VW Avg Unk. Pr: 0.0000
Buy:Sell 1:2.08 (33.5% "buys"), DlyShts 342362 (20.83%), Dly Sht % of 'sells' 29.83%
Trade volume was up +46.23% from yesterday's ~1.124MM shares while daily short sales were up +426.71%. This leaves the daily short percentage still low but nearer normal for a healthy market. Knowing that our situation is that daily short sales seem to increase and decrease in correlation with "buys", I think daily shorts were result of "late-day strength". Look at the time breakdown below and you'll see the buy percentage substantially improved, generally, from 13:00 onward. Normally we have "late-day weakness".
Speaking of price, we've sure been hanging in around the 50-day SMA, $0.1242 today. I don't know what is causing this sort of trading - until the last few days we had a solid trend of lower highs. These last three days the lows held or improved a bit though, along with the highs. If you look at the breakdown by price range below you'll see that volume and price was strongest around the 50-day SMA area.
This makes two consecutive days with strengthening volume on an improved VWAP. And we topped right at a price resistance line I had in place which goes back to 6/26's low and touches several places, including the top of our sideways trading 8/23-9/10. The price range seems to be high $0.138x - $0.14. If we break above this and confirm, we might have some upside available. With improving volume, VWAP, buy percentages, daily short percentage and some traditional TA patterns, it looks possible.
ARCA was in from the get-go today and we got the expected results until around 12:45, as can be seen in the trading breakdown by time, where we had VWAP go from an initial $0.1289 to $0.1210 on about 24.4% of the day's volume. I think what caused the cessation of the drop is that around 12:00 the bids began to come off the nadir and started creeping up. ARCA and the usual suspects began to move the offers up slowly.
I think there was some "stealth buying" going on as I saw a strange behavior, which I detailed in this comment. If that was the case, the "late-day strengthening" would be a natural result of that. The folks on the sell side are probably at least as astute as I (and they likely have better computer help) and would have noticed this behavior as well.
This seems supported by the time breakdown below where we see:
14:01-14:50: 343480 shrs, 20.89% of vol, VWAP $0.1233, 40.9% buys
This was the strongest period during the day, in terms of volume, and it continued a trend of price improvement begun in the prior hour.
My original inflection point calculations continue saying weakening, with only the 10-day having a minor disagreement. Since we only got them all in agreement a couple days ago, it's not unusual to have one or more show minor disagreement as older values fall out of the window.
The newer version still disagrees to some extent. The 5-day continues to roll over and suggest increasing weakness while the other periods suggest weakening is lessening.
Yesterday I said, after mentioning the 5 and 10-day calculations were suggesting weakness ahead of the longer periods, "If my newer version is more reliable, I've got to believe the 5 and 10-day calculations are leading the longer periods". The proof will be in the pudding - will today retreat from yesterday's strengthening price and volume or continue upward?
I don't know.
On the traditional TA front, trading range is still wrapped around the 50-day SMA, now $0.1242, and price topped right at a resistance line, detailed above. Close and high are pretty much at the upper Bollinger limit, after getting centered in the middle of the Bollinger band yesterday. I mentioned yesterday we had made a "Gravestone Doji", which Bulkowski says statistically is darn near random as far as accuracy of predicting a drop. For today at least, random won. I had said this time, since I had other things suggesting we should continue to weaken, I'm believing it. Today should tell the tale - random or on the money this time.
For now we've broken our descending pattern (either a wedge or channel - can't tell yet), which is very short-term and can't be considered "gospel" yet. It's possible, because we topped at that price resistance I mentioned, that we're entering a sideways consolidation again. The pattern of highs and lows since we bottomed in the $0.10xx range suggests this is possible, maybe even likely.
Here's intra-day trading by arbitrary time breakdown.
09:30-09:30: 050000 shrs, 03.04% of vol, VWAP $0.1289, 100.0% buys
09:34-09:35: 069000 shrs, 04.20% of vol, VWAP $0.1250, 0.0% buys
09:47-10:59: 132646 shrs, 08.07% of vol, VWAP $0.1213, 4.3% buys
11:02-11:52: 073500 shrs, 04.47% of vol, VWAP $0.1223, 53.1% buys
12:00-12:43: 075500 shrs, 04.59% of vol, VWAP $0.1210, 6.6% buys
13:01-13:58: 038500 shrs, 02.34% of vol, VWAP $0.1222, 36.4% buys
14:01-14:50: 343480 shrs, 20.89% of vol, VWAP $0.1233, 40.9% buys
14:50-14:59: 269962 shrs, 16.42% of vol, VWAP $0.1242, 35.2% buys
15:02-15:30: 279315 shrs, 16.99% of vol, VWAP $0.1244, 22.4% buys
15:31-15:45: 128000 shrs, 07.79% of vol, VWAP $0.1259, 30.9% buys
15:46-15:57: 184000 shrs, 11.19% of vol, VWAP $0.1325, 54.3% buys
Here's intra-day trading by arbitrary price breakdown.
$0.1203-$0.1213: 223146 shrs, 13.57% of vol, VWAP $0.1210, b:s 1:42.36, 2.3% buys
$0.1215-$0.1225: 195080 shrs, 11.87% of vol, VWAP $0.1224, b:s 1:31.51, 3.1% buys
$0.1230-$0.1239: 354400 shrs, 21.56% of vol, VWAP $0.1235, b:s 1:1.01, 49.8% buys
$0.1240-$0.1258: 630777 shrs, 38.37% of vol, VWAP $0.1248, b:s 1:2.59, 30.3% buys
$0.1260-$0.1298: 102500 shrs, 06.24% of vol, VWAP $0.1288, b:s 19.50:1, 95.1% buys
$0.1300-$0.1350: 088000 shrs, 05.35% of vol, VWAP $0.1310, b:s 1:2.52, 28.4% buys
$0.1380-$0.1400: 050000 shrs, 03.04% of vol, VWAP $0.1395, 100% buys
Some day-to-day VWAP changes, with the end date shown and the percentage change from the prior day. Buy percentage is the last value on each line.
10/22 $0.1334 +02.74% 39.6%
10/23 $0.1322 -00.72% 31.1%
10/24 $0.1285 -02.80% 25.1%
10/25 $0.1254 -02.37% 27.8%
10/28 $0.1267 +01.00% 36.0%
10/29 $0.1274 +00.54% 55.6%
10/30 $0.1232 -03.25% 23.3%
10/31 $0.1222 -00.84% 21.2%
11/01 $0.1249 +02.20% 19.9%
11/04 $0.1289 +03.25% 33.5%
This week's daily estimated values (older dailys in prior EOD posts in prior instablog) for next share issue:
11/04: 20 lowest intra-day VWAPs in 40 days avg, $0.1195, x 85%: $0.1015
Vol, in K, for above days: 1,643.90.
Week ending summaries of PIPE financing estimated 85% share pricing, "Dly Sht % of 'sells'", and inflection points here are in the latest daily post above.
11/01/2013: EOD stuff partially copied to the concentrator.
# Trds: 101, MinTrSz: 254, MaxTrSz: 75000, Vol: 1124204, AvTrSz: 11131
Min. Pr: 0.1200, Max Pr: 0.1298, VW Avg. Tr. Pr: 0.1249
# Buys, Shares: 23 223600, VW Avg Buy Pr: 0.1229
# Sells, Shares: 77 872854, VW Avg Sell Pr: 0.1255
# Unkn, Shares: 1 27750, VW Avg Unk. Pr: 0.1210
Buy:Sell 1:3.90 (19.9% "buys"), DlyShts 65000 (5.78%), Dly Sht % of 'sells' 7.45%
The PIPErs got a couple of gifts today.
At 10:42 the bid side included $0.1269x403K from CDEL (most hidden until 14:46) and $0.12 with 130K, 68K, 35K, 59K and 5K(2) from ATDF, CDEL, CSTI, ETRF, PERT and STXG. There's another gift for them under the tree: apparent GTC bids of $0.11x50Kx421K from BNCH and CANT. The $0.12 bid got augmented with another 10K when that bid percolated to the top (well, really was dug out of the cellar, as you will see shortly).
To shorten my normally longer commentary about this sort of stuff, I'll just post a few factoids and a few comments.
Through 13:24, buy percentage was 5.07%, meaning the hitting of the bids accounted for 94.93% of the volume (including "unknown", which I believe were likely "sells"). Volume traded was 720,600, 64.10% of the day's trade volume. VWAP was $0.1269, +3.82% over yesterday's VWAP of $0.1222. Assuming the PIPErs paid $0.1018 for the shares they dumped today, they scarfed a nice 24.63% profit on these shares.
The buy:sell tells us the PIPErs aren't ones to look a gift horse in the mouth. It's more clearly seen in the intra-day trade breakdowns.
That's how they "dug out of the cellar" the $0.12 bids. Fortunately, ATDF, CDEL and some others, whom I didn't catch, came in with $0.1201, $0.121, ... bids from then until 14:45, preventing the PIPErs from taking us to $0.11xx today, as they surely would have if these better bids hadn't appeared, assuming the usual PIPErs' behavior. Probably do it in the next couple days.
Thereafter, the buy percentage was 46.36% on 187,100 shares with a VWAP of $0.1213. a still-nice profit of 19.17% if they paid $0.1018 for the shares. The later-day improvement in buy percentage is quite common as price sinks. Since we typically have "late-day weakness", it's common behavior.
It must be nice to have multi-million share tranches priced 20% or so below current market dumped in your lap. Folks like us go on buying sprees while PIPErs go on selling sprees.
Daily short sales took a huge drop. Trade volume was up +83.17% while daily short volume was up only +35.48%. This gave us an ending daily short percentage of 5.78%. This fits with my recent brief comments on "high volume: high buy %, high daily shorts; low buy %, low daily shorts". Of course, it doesn't always hold and if I hadn't been looking at buy:sell intra-day I might not have suspected this low daily short sales percentage was coming.
Low daily short percentage, if continued (I think it will continue), almost certainly means that price will auger into the $0.11xx, and likely lower, range.
My original inflection point calculations finally have the 5 and 10-day periods starting to reflect what the longer periods have been saying: weakening! Took 'em long enough! All periods but the 50-day agree. The 50-day is showing a slight reduction in weakening. Since it's an outlier ATM, I think it should be discounted.
The newer version, intended to be more stable, disagrees to some extent. The 5 and 10-day are clearly rolling over to show the start of increasing weakness. But likely due to the fact that other than just buy:sell is considered, the other periods suggest weakening is reducing. This matches what can be seen on the charts in the price and volume: we topped out 10/22 from the "pop" and the inflection point charts were showing instability and indecision with a slight upward bias a few days prior to that. All periods began the early leg of the move lower from Friday, 10/18, to Monday 10/21. Our VWAPs have since dropped into the low-to-mid $0.12 range since and managed to hang in there, surprisingly to me.
If my newer version is more reliable, I've got to believe the 5 and 10-day calculations are leading the longer periods.
I believe they are signaling down is near and it won't take long for the other periods to agree if volume and other factors change dramatically enough.
On the traditional TA front, trading range is still wrapped around the 50-day SMA, $0.1243. Open and close are pretty much centered in the middle of the Bollinger band and have made a "Gravestone Doji". Bulkowski says statistically it's darn near random as far as accuracy of predicting a drop though. This time, since I have other things suggesting we should continue to weaken, I'm believing it.
Our price range is in a descending pattern (either a wedge or channel - can't tell yet), although it's very short-term and can't be considered "gospel" yet. This is separate from the long-term descending pattern(s) that one can identify.
Here's intra-day trading by arbitrary time breakdown.
09:30-10:15: 005500 shrs, 00.49% of vol, VWAP $0.1209, 0.0% buys
10:27-10:58: 076600 shrs, 06.81% of vol, VWAP $0.1273, 26.1% buys
11:00-11:57: 375800 shrs, 33.43% of vol, VWAP $0.1269, 0.0% buys
12:15-12:59: 053200 shrs, 04.73% of vol, VWAP $0.1273, 30.1% buys
13:00-13:27: 211500 shrs, 18.81% of vol, VWAP $0.1267, 1.2% buys
13:52-14:03: 020000 shrs, 01.78% of vol, VWAP $0.1246, 100.0% buys
14:33-14:56: 114050 shrs, 10.14% of vol, VWAP $0.1211, 7.7% buys
15:13-15:27: 103500 shrs, 09.21% of vol, VWAP $0.1207, 36.7% buys
15:31-15:43: 098754 shrs, 08.78% of vol, VWAP $0.1217, 80.0% buys
15:46-15:59: 065300 shrs, 05.81% of vol, VWAP $0.1211, 60.2% buys
Here's intra-day trading by arbitrary price breakdown.
$0.1200-$0.1205: 136754 shrs, 12.16% of vol, VWAP $0.1203, b:s 1:3.02, 24.9% buys
$0.1210-$0.1210: 132550 shrs, 11.79% of vol, VWAP $0.1210, b:s 1:2.06, 25.9% buys
$0.1220-$0.1220: 097800 shrs, 08.70% of vol, VWAP $0.1220, b:s 96.80:1, 99.0% buys
$0.1230-$0.1250: 047000 shrs, 04.18% of vol, VWAP $0.1240, b:s 1:1.35, 42.6% buys
$0.1260-$0.1265: 032500 shrs, 02.89% of vol, VWAP $0.1260, b:s 1:12.00, 7.7% buys
$0.1269-$0.1269: 605100 shrs, 53.82% of vol, VWAP $0.1269, b:s 1:59.51, 1.7% buys
$0.1270-$0.1298: 072500 shrs, 06.45% of vol, VWAP $0.1276, b:s 1:1.79, 35.9% buys
Some day-to-day VWAP changes, with the end date shown and the percentage change from the prior day. Buy percentage is the last value on each line.
10/21 $0.1283 -00.23% 34.7%
10/22 $0.1334 +02.74% 39.6%
10/23 $0.1322 -00.72% 31.1%
10/24 $0.1285 -02.80% 25.1%
10/25 $0.1254 -02.37% 27.8%
10/28 $0.1267 +01.00% 36.0%
10/29 $0.1274 +00.54% 55.6%
10/30 $0.1232 -03.25% 23.3%
10/31 $0.1222 -00.84% 21.2%
11/01 $0.1249 +02.20% 19.9%
This week's daily estimated values (older dailys in prior EOD posts in prior instablog) for next share issue:
10/28: 20 lowest intra-day VWAPs in 40 days avg, $0.1198, x 85%: $0.1018
10/29: 20 lowest intra-day VWAPs in 40 days avg, $0.1198, x 85%: $0.1018
10/30: 20 lowest intra-day VWAPs in 40 days avg, $0.1197, x 85%: $0.1017
10/31: 20 lowest intra-day VWAPs in 40 days avg, $0.1195, x 85%: $0.1016
11/01: 20 lowest intra-day VWAPs in 40 days avg, $0.1195, x 85%: $0.1015
Vol, in K, for above days: 564.85, 542.55, 673.22, 613.76, 1,124.20.
Week ending summaries of PIPE financing estimated 85% share pricing, "Dly Sht % of 'sells'", and inflection points here are in the latest daily post above.
Disclosure: I am long AXPW.
Additional disclosure: I am very experimental and sometimes do my TA in non-traditional fashions. Keep this in mind when considering anything I post and be sure and consult other sources and do your due diligence. I'm barely responsible for myself and certainly not responsible for anyone else or their actions. :-)