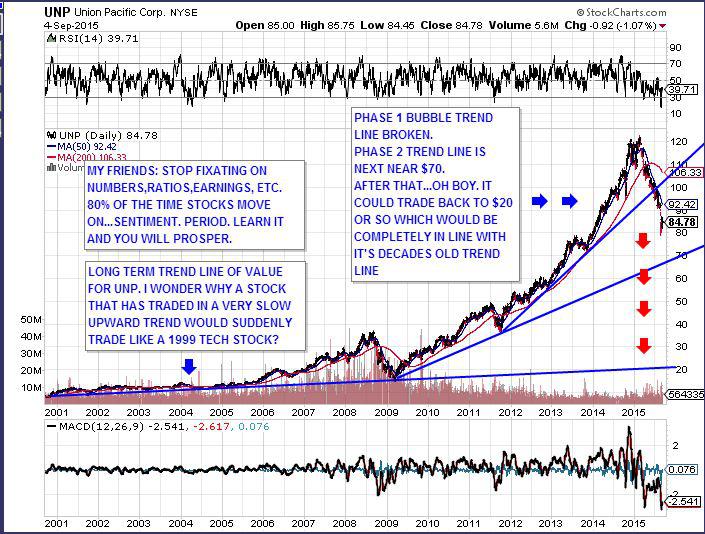
Just another simple chart (as I have provided many lately) as I attempt to help people understand that all stocks have a long term trend line of value. All stocks will revert to that trend line over time.
$UNP is not immune to this as the dividend bubble and investor sentiment deflates.
Added 12/29/15:
There have been a decent number of UNP articles attempting to convince people that numbers, ratios, etc. will assure them of coming riches by buying UNP stock here ($78). UNP is in a bubble, as are many investor favorite dividend stocks. Individual investors have all piled into the exact same stocks thanks to the media claiming you have to own "blue chip" stocks, "past performance guarantees future results", etc.
There absolutely will be time in the future you can buy UNP for long term percentage gains and it will be somewhere much lower from today's prices. Look at the upcoming chart and ask yourself: "For almost a quarter of a century the stock traded in a range from $5-$15 per share. Bull market, bear market, bull, bear, etc. What they heck changed that this stock should trade like a 1999 tech stock"??
I will tell you: nothing. Nothing but a Federal Reserve free money, zero interest rate bull market where individual investors all piled into the exact same dividend paying stocks.
Here is what is going to happen folks: If you bought UNP anywhere above $70 thinking that you are going to see that money again over the next 30 years= you are dreaming!! I really feel for the people who bought over $100 who have been rationalizing ever dollar down in stock price as the bottom or soon to be bottom. Every Seeking Alpha article where ratios, numbers, etc have been rolled out in order to convince yourselves that any of this is going to matter.
I want to add this chart so maybe, just maybe people will start to think beyond the hype they read: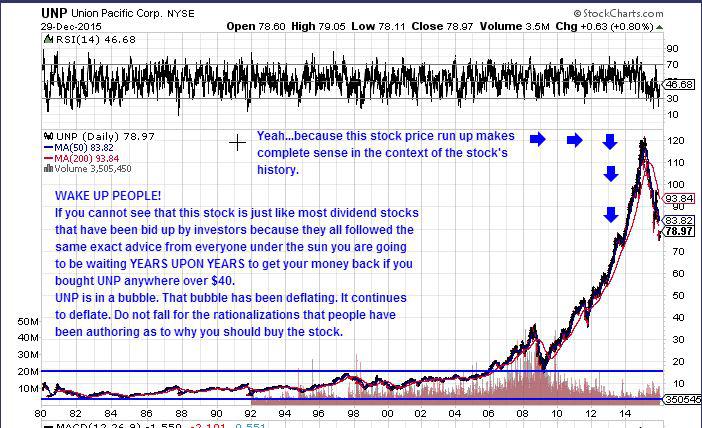
In the end: The price you pay DOES matter.