A Goldilocks jobs report, a U.S. GDP that rose a better than expected four percent, U.S. manufacturing activity at its highest level in three years, a U.S. economy that's looking better month after month and discretionary consumer spending for durable goods at the fastest pace in almost five years and last Thursday the market tanked in its biggest one-day selloff since last February - go figure!
Consensus among market strategists has it that economy-wise things out there are revving up to the point where the Fed surely has to shut its QE easy money spigot sooner rather than later. But the market hates the thought of this, and so took a nosedive.
But the Fed Chair Janet Yellen opined that interest rates will remain at record low levels even with the economy improving, and the market should like that to the point where it will set up for a major advance but not just yet, and that's a good thing.
Last week's sharp selloff shows how quickly the bullish sentiment and calm in Wall Street can go with the wind. It also showed that staying in cash at the sidelines doing nothing, was the right strategy to use. Major indexes were way up in nosebleed territory and may have to come down some more before the bleeding stops. But that is worth waiting for because chances are that a decent selloff could trigger a switch to the buy-side reminiscent of March 2009.
But for now, that's still a big if and so it's best to stay at the sidelines a bit longer.
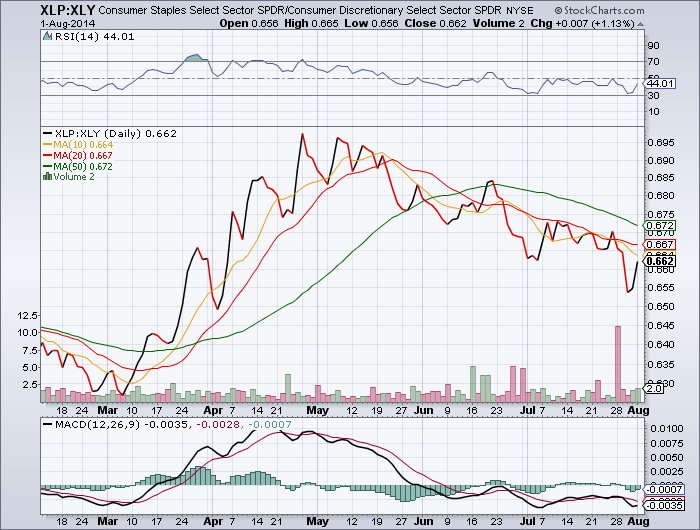
When you check the next two charts you could figure that the market is suffering from a split personality. Note that even though the XLP: XLY ratio has bounced off its low, it remains in a solid downtrend with its Moving Average lines configuration [green line above the red line] strongly negative for the bears. Keep in mind that a decline in this ratio is bullish for the market.
By contrast, this market forecasting junk-bond canary [JNK] reflects a market that is ready to give up the ghost. Not only did the MACD momentum index and RSI strength indicator sink into their respective bearish territories, but for the first time since March 2012 is the MA lines configuration for the JNK turning bearish with the green line rising above the red, and that can put the kibosh on any market or index. So maybe the bears out there who are predicting a 20 percent rout for the market are going to be right after all.

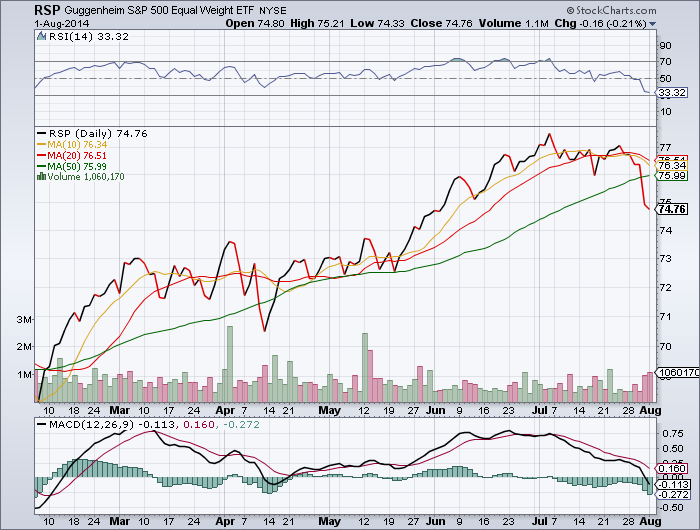
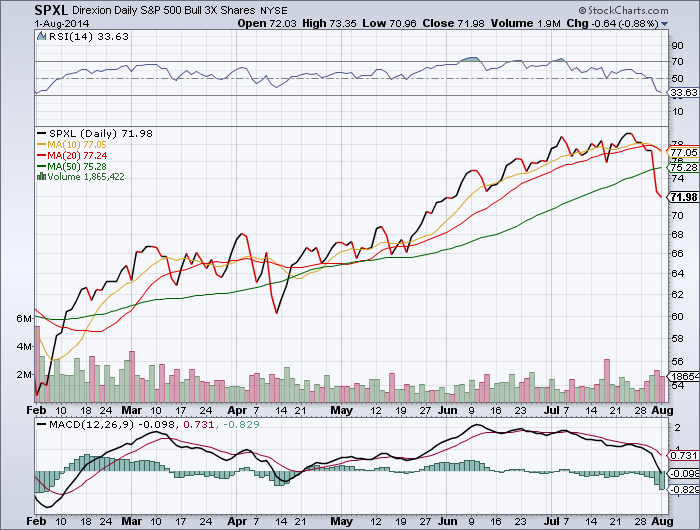
Check out the Troika and note that the two bull components [RSP] and [SPXL] are engaged in a deep nosedive. Not to be outdone, the respective MACD momentum and RSI strength indicators are following suit, all of which is sharply bearish for the market. The only bright spot for the bulls are the respective MA lines configuration [green lines below the red] which indicates that any selloff will be short-lived, followed by either a consolidation period, or even a snap-back rally.
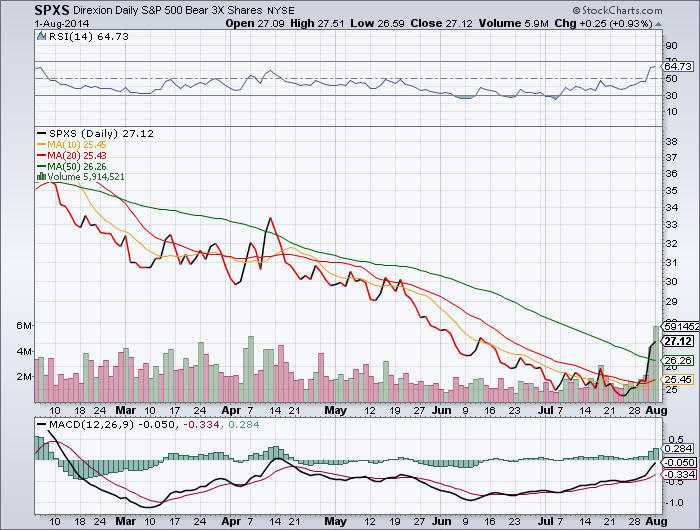
With the bulls down, the bears [SPXS] had themselves a bit of a liftoff rally out of the hole they had been in for quite a while. A big plus for the bears is that the MACD momentum bars and RSI strength indicator have both snapped into their respective positive territories.
But what will keep the bears subdued is its MA lines configuration [green line above the red] and for as long as that is the case the bears won't have a chance to any lasting damage to the market.
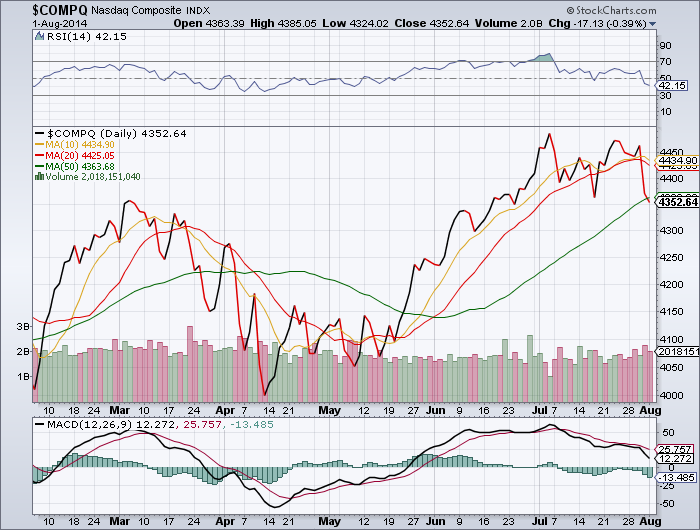
Although the NASDAQ composite [COMPQ] is being hit hard along with other indexes, its MA lines configuration remains remarkably bullish [green line below the red] which is another indication that this selloff will be of short duration. But that both the MACD momentum bars and RSI strength indicator have slipped into their respective bearish territories are signs that the bias of the market is still to the downside.
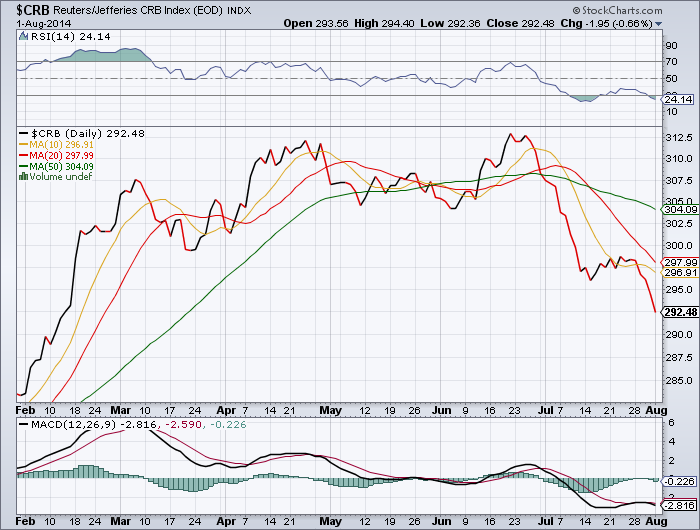
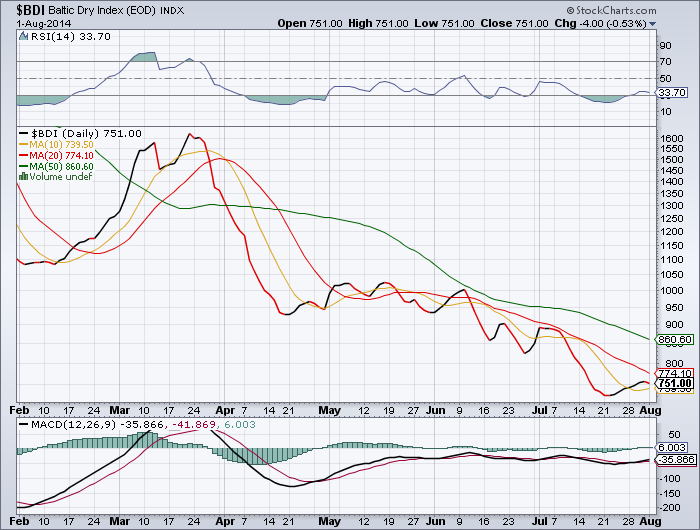
The commodity producers' index [CRB] as well as the commodity demand indicator [BDI] both show that these sectors of the market remain exceedingly bearish. This negative environment for the commodity market is not going to change for as long as its MA lines configuration [green line above the red] continues to be in such a bearish mode.
After forming this ominous double top at the beginning of July, the [NFO] insiders in this game never looked back on the way down. This double top was another signal to stay in cash at the sidelines for a while and see how things developed.
While this index and its MACD momentum bars along with the RSI strength indicator sold off in unison, its MA lines configuration remained remarkable bullish [green line below the red.] This gave hope that this selloff was short and wouldn't last. But with the red MA line slipping below the green, this hope is gone with the insiders asking "how far is down?"
Yet, this existing bearish sentiment can turn into a contrarian indicator. Bullish sentiment in Wall Street has slipped to a 13-month low, and investors' pessimism is even more pronounced than it was at the market's low in March 2009. Now, to a contrarian "that" is bullish. Go figure.
In any event, with the downside here, be prepared for the upside, which could become quite substantial.

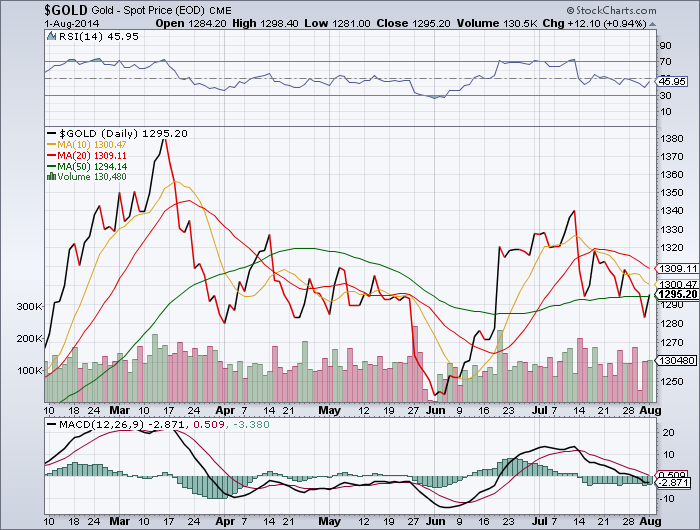
Gold is being pulled in both directions. Its index [GOLD] appears to be in a freefall while its MA lines configuration [green line below the red] remains strongly bullish. At first glance, this appears to be shaping up to a good buying opportunity for the yellow metal.
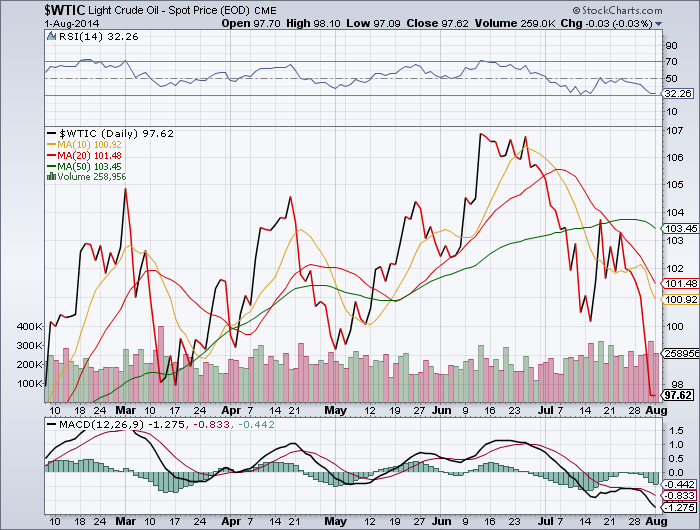
Oil remains a basket case. While this index [WTIC] is digging a hole into the ground it is being assisted by its sharply bearish MA lines configuration [green line above the red] and ditto for its MACD momentum and RSI strength indicators.
Put it all together, and it appears that there are forces at work which are setting the market up that after a brief, albeit sharp, selloff the major indexes will resume their romp to higher highs.
Here are some ETFs for any occasion.
Favored sectors:
Financials, Technology, Gold, Semis, Biotech.
Leveraged Bull-ETFs:
Gold Explorers 3x (CLDX), Gold Miners 2x (NUGT), Jr. Gold Miners 3x (JNYG), S&P 500, 3x (SPXL), DOW 30, 3x (UDOW), Mid-Caps 3x (UMDD), Technology 3x (TECL), Financials 3x (FAS), NASDAQ 2x (QLD), Small-Caps 3x (TNA), Semis 3x (SOXL), Biotech 2x (BIB),
Non-Leveraged Long ETFs:
Discretionary (VCR), Semis (SOXX), Biotech (BBH), Jr. Gold-Miners (GDXJ), Technology (XLK), Financials (IYF), India (PIN), Russell 2000 (IWN), NASDAQ 100 (QQQ), S&P 500 (IVW), Transports (XTN), China (FXI), Large-Caps (EZM), Mega-Caps (MGK), DOW 30 (DPD).
Leveraged Bear-ETFs:
DOW 30, 3x (SDOW), Oil 2x (DTO), Nat-Gas 3x (DGAZ), Oil&Gas 2x (DUG), DOW 30, 2x (DXD), Materials 2x (SMN), S&P 500, 2x (SDS), Financials 2x (SKF), Energy 3x (ERY), NASDAQ 2x (QID), Russell 2000, 2x (TWM), Small-Caps 3x (TZA), Semis 3x (SOXS), Biotech 2x (BIS).
Non-Leveraged Short ETFs:
DOW 30, (DOG), Emerging Markets (EUM), S&P 500 (SH), NASDAQ (PSQ), Russell 2000 (RWM), Active Bear (HDGE), Oil (DNO), Mid-Caps (MYY), Materials (SBM).
GOOD LUCK!