Last week, Wall Street continued its alternating triple digit daily swings in both directions. One of these selling squalls was triggered by the Fed's announcement that they had dropped their "patience" in regards to rate-hikes, along with the usual forward guidance if and when, etc. etc.
It means that the Fed is about to inject "uncertainty" into the financial markets. After spending the last six years trying to calm investors' nerves with explicit assurances that the Fed would be patient with the prospect of raising rates, now they left the door wide open to raise rates at any time without notice, and that triggered Wall Street into another selling binge.
But by the end of last week it dawned on the street that an easy-money QE by the European Central Bank would initiate the same success "over there" as it had "over here" and so the easy-money train would be back on track.
Last week, the Fed put rate-hikes back in play even though the Fed Chair Janet Yellen insisted that they are in no rush to pull the trigger. But the money-flow isn't waiting and so the green-backs are establishing beachheads in the European financial markets to make sure that U.S. international equity are well positioned in the bonanza unfolding over there.
Check this weekly European index [HEDJ] and you get the picture.

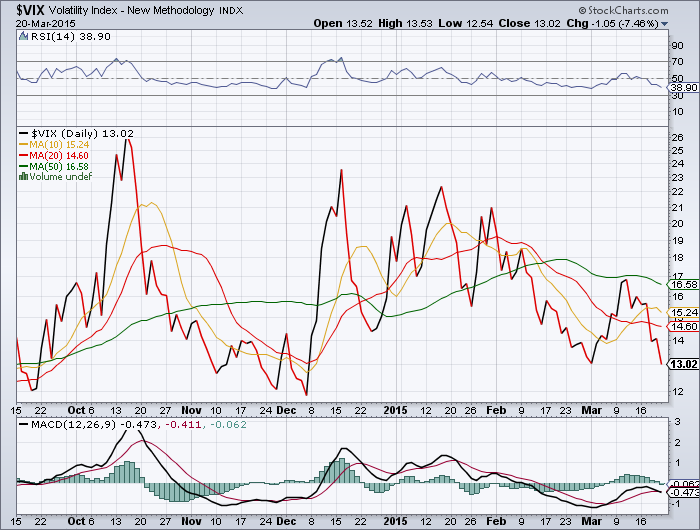
The market's most prominent fear index [VIX] appears to have given up the ghost. This shows that no matter what, this market does not worry. After a pretty sharp scare at the beginning of March when this index showed signs of spiking, the VIX is back at its seemingly comatose stage.
It's Moving-Average lines configuration is exceedingly bearish [for the bears] with a large gap between the green line above the red, the RSI strength indicator for the VIX is back in bearish territory again, and the MACD momentum bars are out cold on top of the demarcation line.
But caution is called for because this lack of fear exhibited by the VIX could become a fear signal on its own.
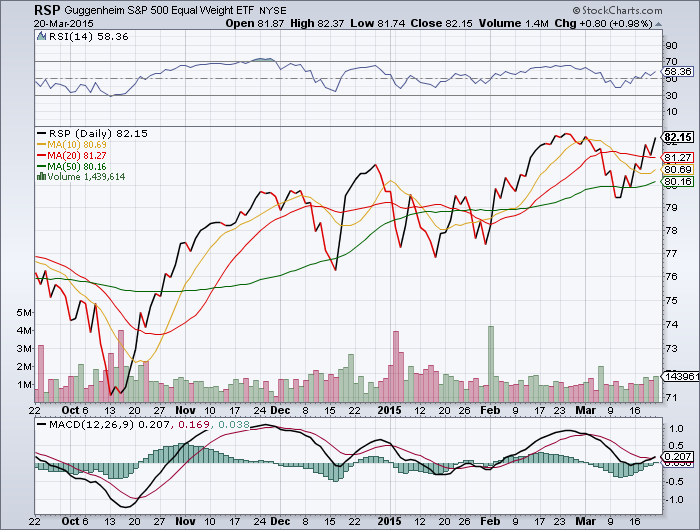
Check the Troika and note that the benchmark [RSP] has broken out from the slump in early March with triple digit zigzag steps, which could mean that the market is hitting a ceiling. But then again, it could mean that the market is establishing a floor from which to reach for higher highs. The next couple of weeks should tell.
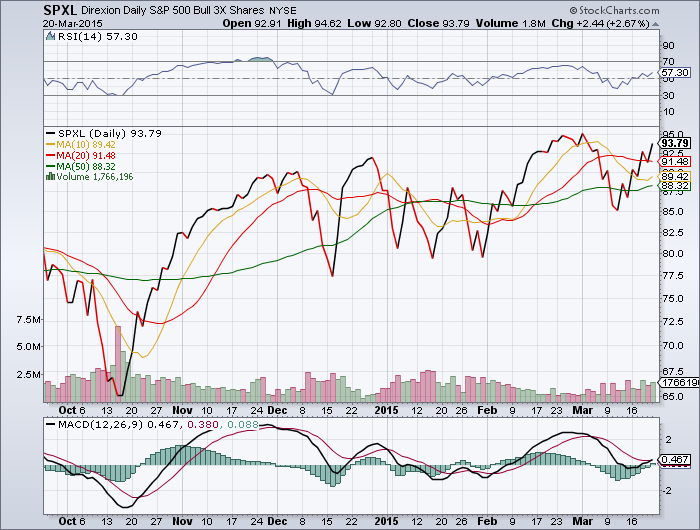
The bull-index [SPXL] of this Troika shows a positive MA lines configuration [green line below the red.] But with the gap between these two lines a bit too wide, it shows that the market is somewhat overbought and top-heavy. It remains to be seen if this represents a ceiling from which to retreat, or a floor from which to advance further.
Note that the MACD momentum bars are at dead neutral on top of the demarcation line, meaning that the market is just floating here, without a definitive up or down.
But with the RSI strength indicator back in positive territory again, the bull is starting to snort and ready to push the market to higher highs. But for now, it's still too early to tell.
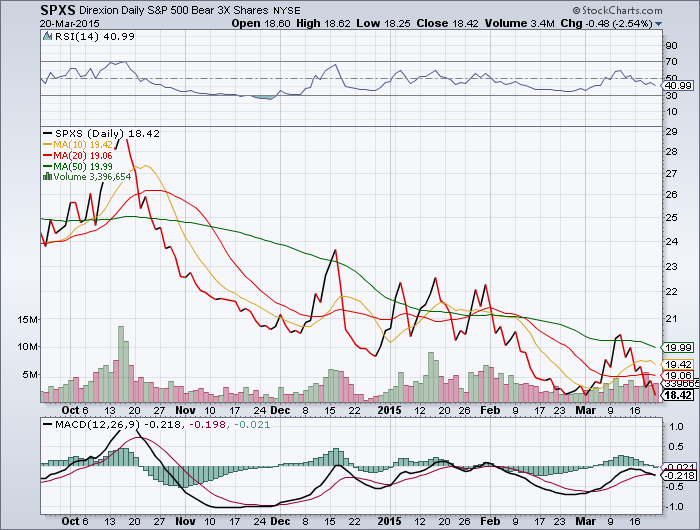
After showing some life a couple of weeks ago, the bear [SPXS] of this Troika is back in its spring hibernation mode. This index is again digging itself into a deeper hole at the bottom of a deep pit. The MA lines configuration remains strongly bearish for the bears [large gap between the green line above the red] the RSI strength indicator has slipped into bearish territory and the MADC signal momentum bars are totally neutral on top of the demarcation line.
So it appears that the bear is out of this game completely. Or is it?
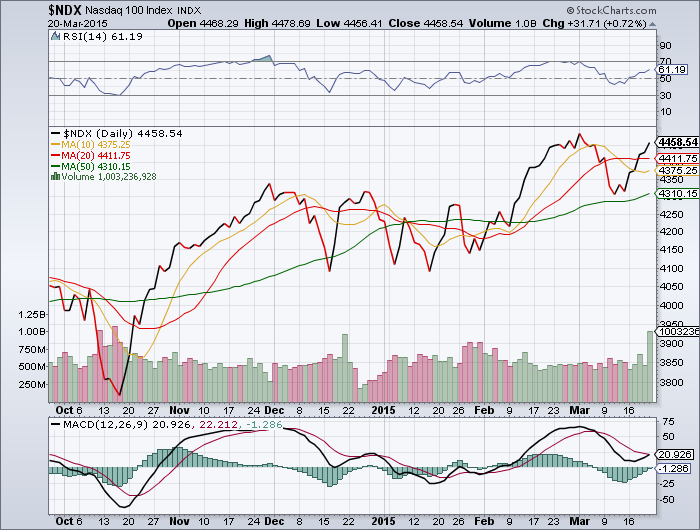
NASDAQ [NDX] came back strongly after the recent selloff, and so the MA lines configuration became a bit too bullish with a large gap between the green line below the red line. This means that the market is still somewhat top-heavy, overbought and ready for a bit of a pullback, which of course would be a buying opportunity.
The RSI strength indicator is back in bullish territory again, and that bodes well for the market in the weeks ahead. But with the MACD momentum bars still at dead-neutral at the demarcation line, it remains to be seen if upside momentum can kick into gear and drive the market higher.
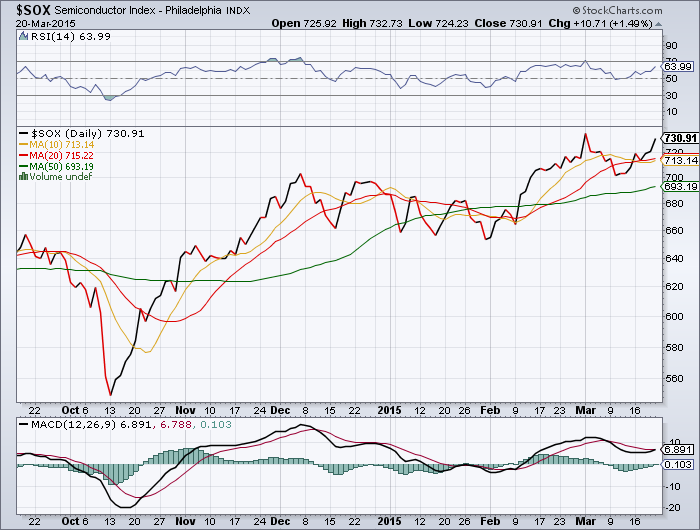
One of the main components of the NASDAQ market is the semiconductors section, which has been in a bit of a slump lately. But after some hiccups and some consolidation, semis appear to be back in gear again, and that would be bullish for the total tech sector of the market. The MA lines configuration for this index [SOX] is bullish with the green line below the red, and the RSI strength indicator along with the MACD momentum index are both solid in their respective bullish territories again.
All of that bodes well for the market as a whole, because semiconductors are among the key drivers for economic growth, and that makes them a proxy for the stock market.
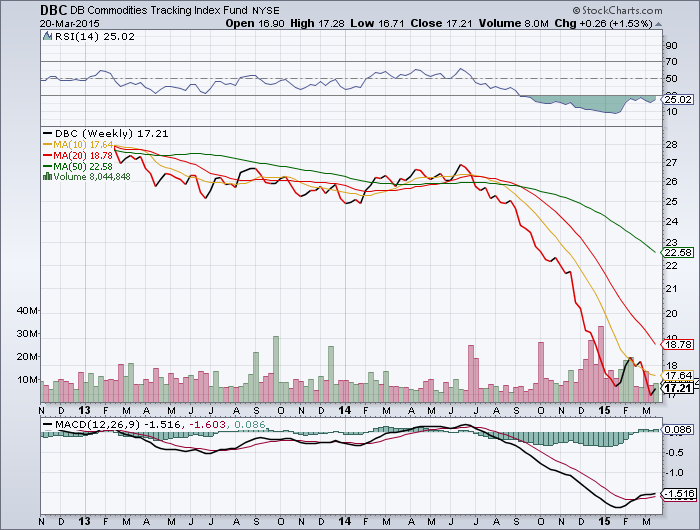
This commodity index [DBC] just shows how much trouble this market is in. The only good thing here is that the MACD momentum bars appear to be trying getting back above the demarcation line again. If they succeed, commodities may get a chance to rally once more in the weeks ahead.
But for now, this is a big maybe.
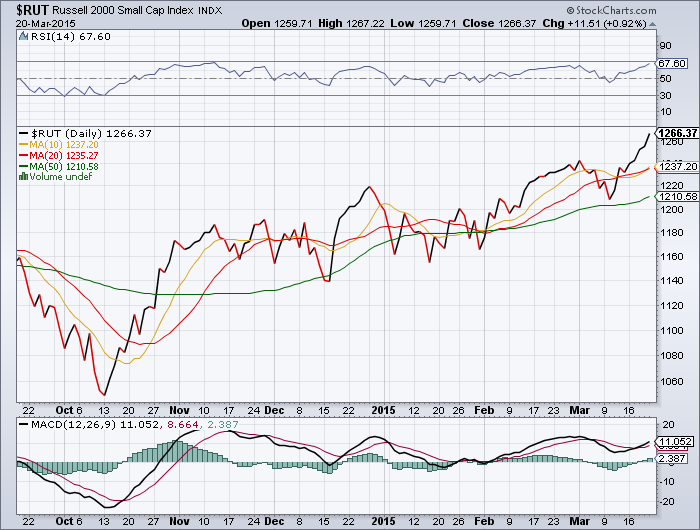
Small-Caps [RUT] are back in charge and are eagerly reaching for higher highs again. But this sector got a little too rambunctious and may have to pull back a bit to find renewed traction to higher highs. That would make for great buying opportunities among the small-cap ETFs.
Note that the MA lines configuration for this index remains solidly bullish [green line below the red] while the RSI strength indicator remains deep in its bullish territory.
Now the MACD momentum bars are getting back on top of the demarcation line, and that will intensify the boost behind the small-caps.
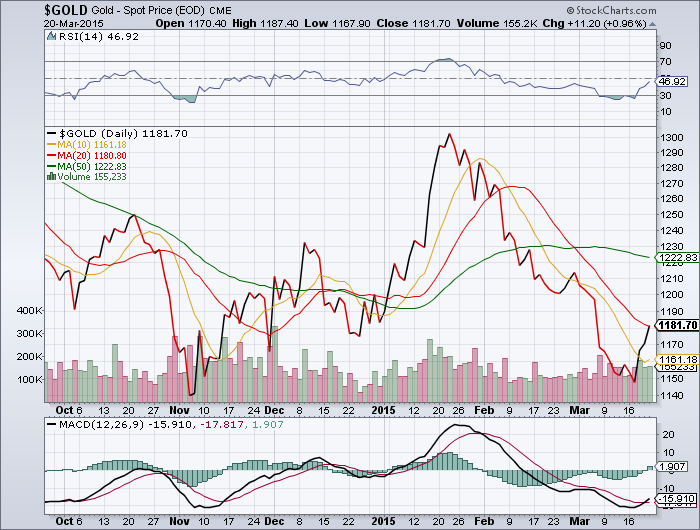
The yellow metal [GOLD] is trying to break lose off the bottom, but is having a tough time doing so. Although gold succeeded in having a bit of a snap-back rally, its MA lines configuration [green line above the red] remains sharply bearish and so is its MACD momentum index.
But with the RSI strength indicator trying to reach positive territory and the MACD momentum bars back on top of the demarcation line, something bullish could be developing for gold, but it will take a while.
Ever since last October the MA lines configuration for oil [WTIC] has been bearish [green line above the red.] For as long as that is the case, the price of crude remains stuck at the bottom of a deep hole way down in a deep pit.

Keep in mind that this is mainly still a "wait and see" market, but with a bias to the upside. So continued caution is called for.
But for those of you who can handle the risk, here are some favored ETFs poised to perform well.
ETF sectors:
Discretionary, Technology, Biotech, Healthcare, Materials;
Leveraged Bull ETFs:
NASDAQ 2x (QLD), Financials 3x (FAS), DOW 2x (DDM), Materials 2x (UYM), Small-Caps 3x (TNA), Semis 2x (USD), Biotech 2x (BIB), Russell 2000, 2x (UWM), Technology 3x (TECL), Euro Bull 3x (EURL) Healthcare 3x (CURE);
Non-Leveraged Long ETFs:
Healthcare (FXH), Technology (XLK), Biotech (BBP) Medical (SBIO), Discretionary (FDIS), Info-Tech (FTEC), Materials (RTM), Europe Long (VGK); S&P 500 (IVV), Semis (SOXX);
Leveraged Bear ETFs:
Semis 3x (SOXS), S&P 500, 2x (SDS), NASDAQ 2x (QID), Financials 3x (FAZ), Energy 3x (ERY), Small-Caps 3x (TZA), Commodity 2x (DEE), Oil 2x (DTO), Materials 2x (SMN), Biotech 2x (BIS), Small-Caps 2x (SDD), Utilities 2x (SDP);
Non-Leveraged Short ETFs:
Commodity (DDP), DOW 30 (DOG), Materials (SBM), Financials (SEF), Mid-Caps (MYY), Small-Caps (SBB), NASDAQ (PSQ), Russell 2000 (RWM), Equity Bear (HDGE), S&P 500 (SH);
(GOOD LUCK!