Not enough time to write an article, but here's a snapshot of the current action:
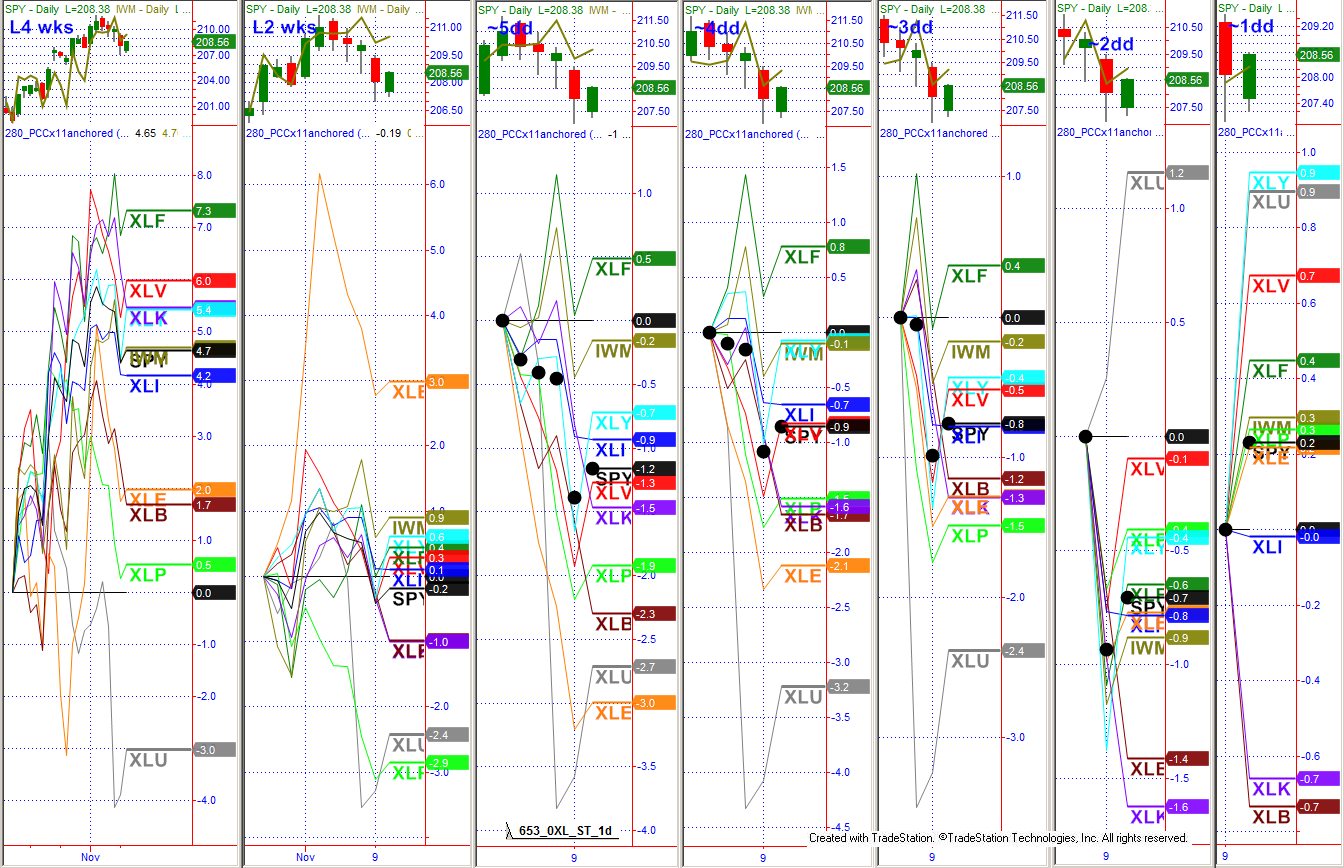
CHART NOTE: For some unknown reason, TrdStn is "not good at counting low numbers", so for the daily charts - do NOT rely on the legend at top: count the black dots and subtract 1 = that is the number of days. This chart happens to be correct (after close?).
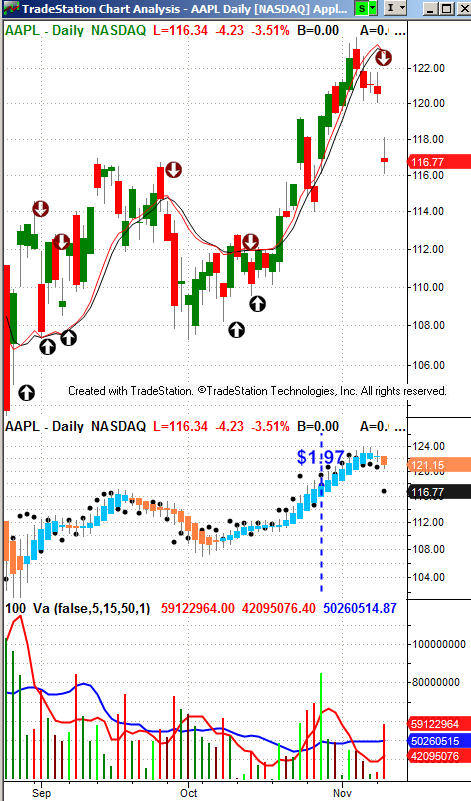
Tech is suffering. Want a hint why? Below are the top 10 stocks in the XLK, and this index is fairly concentrated using the top 10, but it is THE 2ND MOST CONCENTRATED among the XLs taking just the top 2 (only XLE is higher, with XOM+CVX=30%). Are you smart enough to figure out my table without help?
XLK | ||||
AAPL | 1 | 16.0% | 16.0% | 75 |
MSFT | 2 | 10.1% | 26.1% | 74 |
FB | 3 | 5.6% | 31.7% | 73 |
GOOGL | 4 | 5.1% | 36.8% | 72 |
GOOG | 5 | 5.0% | 41.8% | 71 |
T | 6 | 4.7% | 46.5% | 70 |
VZ | 7 | 4.3% | 50.9% | 69 |
V | 8 | 3.6% | 54.4% | 68 |
CSCO | 9 | 3.3% | 57.7% | 67 |
INTC | 10 | 3.2% | 60.9% | 66 |
Regarding other sectors - aka a recent Instablog comment, XLF is still strong after the "high employment number"/rate-hike pop, but I have not seen anything particularly wonderful regarding the potentially nice/bad chart formations - no "island tops" (abandoned babies, etc) were created. The market is pulling back short-term but technicals still look good long-term, it's just with this schizo market, I wonder when the bad news=bad, then bad=good, is going to flip back, so I've decided to play a little, to wit:
BRK.B (or BRK/B, or…) did not have a gap like the other XLFs and looked enough like a "roll over" that I put a couple of short vertical calls out there (Dec -130c/+135c) and half were hit (y$3.30cr, n$3.45cr). This is a short-term play and NOT a recommendation, as it is based on recent technical tools I've emphasized and I have found the only way I really know if the tools work or not is to put some money on them.
Being new tools, these are high-risk plays.
Let me say it again: Being new tools, these are high-risk plays.
I'm trying the same type option strategy on AXP because it gapped down on its earnings announcement, tried to bounce, and could not hold the bounce. I'm hoping for another bounce to enter my short call vertical, but it is an open order, did not hit today, and may be cancelled at any time as changing conditions and prices warrant.
XLY - Discretionary is strong. What I find interesting about that is that these stocks are mostly retailers on a one-month lagged reporting cycle: I covered retail as an analyst - DECADES ago - and I was fairly good, but have NOT done much since then. I do know their delayed reporting cycle is due to Christmas, presumably they want the full effect as well as the fact that they are busy enough at the end of December that they don't need the additional work of reporting earnings and thus choose Jan 31 as the typical fiscal year-end. So, could it be that the stocks are strong because they have NOT reported earnings yet?
I'm analyzing earnings but my data comes from SP Dow Jones indices and if I were to write on it (next week?), I have to get their pre-approval first. (They gave me retro approval AFTER I had written on earnings using their data and THEN found how restrictive they are).
Be aware that there use to be a retail seasonal that you could buy the retailers around labor day and they would out-perform though about Thanksgiving. Seems the play was on optimism, not reality!
Happy holidays :-)
NOTE: XLU strong last couple of days as market pulls back… too short a period to be anything but speculation at this point.
Disclosure: Long XLI, XLK, XLV, XLY. Long SPX put strategies. Short W and BRK.B, and trying to short CC and AXP, may renter CL short (took profit on 240min basis, watching for re-entry).