UPDATE: For those who are interested, I've written a related article for Fortune that explores Apple's renewed volatility in light of the market's heavy selling pressure. You can find that article here.
While my readers know me best for my fundamental analysis and earnings forecasts, I will from time to time address overarching technical or fundamental issues in the broader market when I feel those problems can no longer be ignored. For example, in late April I mentioned to Philip Elmer-Dewitt (see here) that excessive unmitigated risk taking by fund managers as expressed by the ISEE index, the high call-to-put ratio on the CBOE, and the endless bid in the bond market would likely lead to a catastrophic sell-off in May. It was becoming increasingly clear that the European Sovereign debt crisis would eventually manifest itself in a brutal U.S. correction as thecredit default swap market was nearly pricing in a default on Greece, Spain, Portugal, Italy and Ireland’s sovereign debt.
If this wasn’t evidence enough, the fact that the entire February to April rally was done on extremely light volume under the control of algos and high-frequency trading, should have raised quite the red flag. The market reached record over-bought conditions all while heavy mutual fund outflows continued in March and April. The S&P 500 set a new record for the number of days in the green without a sell-off of 1% or more during that rally. The 7-day Relative Strength Index hit levels not seen in 20 years on the S&P 500.This all suggested that the melt-up was more of a pump and dump routine than a real interest-driven rally.
Early in the correction, I followed up with Dewitt, and sent him the following e-mail just 7-minutes prior to the flash crash: “The markets are at very dangerous levels right now.If we don’t see a bounce here soon, we can see things really unravel. Warning bells are ringing everywhere right now on a technical basis. Volatility looks like it’s going to break out.”
The reason I was very concerned about the market minutes before the flash crash was largely due to the fact that I knew much of the market likely had stop loss orders sitting at the very key technical levels of 1140 to 1150 (January highs), and that due to the lack of hedging by the broader market, fund managers were more likely to put in stop losses instead of letting their Put protection, or lack thereof, kick in. If the market was sufficiently hedged ahead of this correction, there’s a good chance we wouldn’t have seen the flash crash. Because even if some of that selling was due to this so called “fat-finger” trade, at least 600 of that point loss on the DJIA was legitimate, orderly, stop-loss selling –I watched the orders go through.
Head & Shoulders Top
The warning I would like to discuss today is a technical problem I saw as potentially forming about a month ago. In an e-mail I sent to a group of day traders dated May 20, 2010, I noted that one of two very bearish technical formations would likely form if the market saw a rally to or near the January highs before testing 1,000 on the S&P 500. Because 1,042 marked the low of the late January to early February correction, a move exactly to this level on the S&P 500 would clearly form a neck-line of a potential 8-month head & shoulders top in the market. The other bearish technical pattern I saw as potentially forming in the market is something called an ascending broadening wedge, which is back-tested as being bearish 78% of the time. See here.
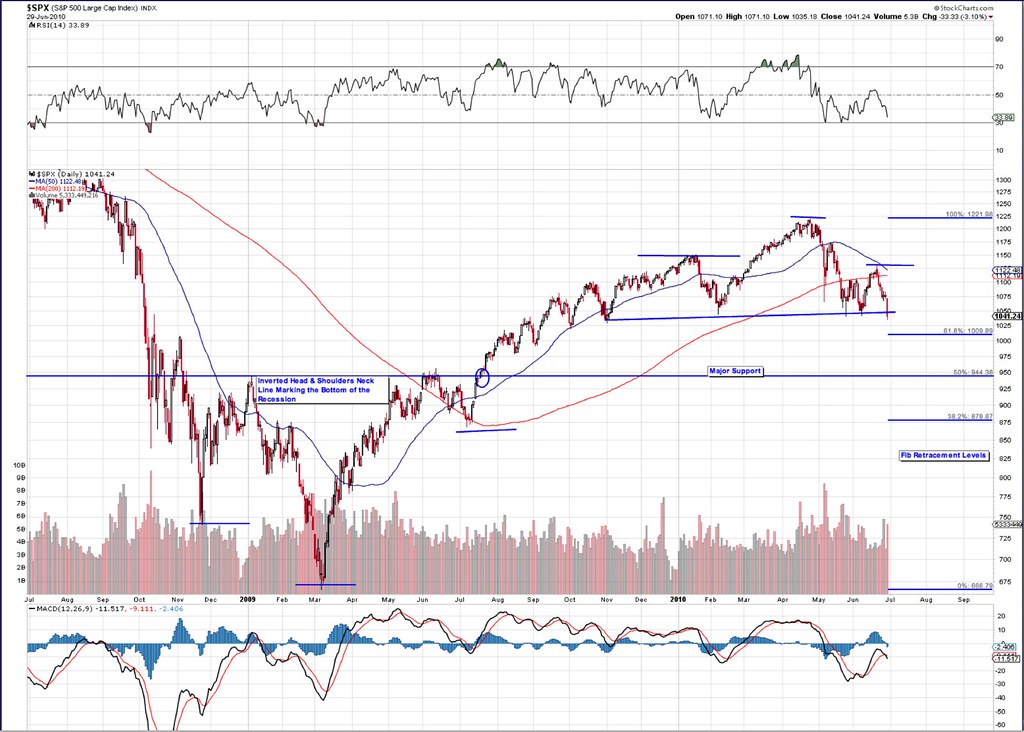
Yet, I think fears over a potential ascending broadening wedge forming is behind us, and now investors are confronted with a grueling head & shoulders top on all the major indices. The NASDAQ, S&P500 and DJIA have all formed a major head & shoulders not seen since the end of the 2003 to 2008 bull market (click links to see the charts). This chart formation is so concerning to me that I am now 100% in cash, and have been in cash for the past eight trading sessions. I believe this pattern can be potentially devastating to either bulls or bears as a strong case can be made on each side of the tape. In 2007, we saw a strikingly similar head & shoulders form on the major indices which marked a decisive top to the 2003 to 2007 bull market. That head & shoulders spanned from March 2007, the first time the term “subprime” was discussed at any length in the media, until January 2008, where the neck line was decidedly broken in that major correction that ended with the collapse of Bear Stearns. Notice how the left shoulder of the 2007 head & shoulders was formed by a market correction on initial fears of the subprime mortgage crisis just as the left shoulder of the 2010 head & shoulders was formed by a correction on initial fears of the European sovereign debt crisis. Just as the markets initially brushed aside potential systemic risk surrounding subprime mortgages by rallying to all time highs on the DJIA (forming a head on the formation), the markets have initially brushed aside potential systemic risk of the European Sovereign debt crisis with a powerful melt up rally to form the head of this bearish formation. A bear will argue that there are a lot of eerie similarities between how the market reacted from a technical standpoint when it was confronted with the subprime mortgage crisis, and how the market is currently reacting from a technical standpoint as it is confronted with the European Sovereign Debt crisis. In both markets, investors ignored initial systemic risk concerns by rallying to new highs only to revisit those concerns and form a neck line. It is precisely when the market gives credence to these systemic risk concerns do we see real weakness in the equity markets. Ben Bernanke gave the markets a strong dose of systemic risk reality when his comments during a White house meeting with President Barack Obama on Tuesday were construed to indicate that problems in Europe might spill over into the United States. Ben Bernanke remarked, “What’s happening around the world in emerging markets, in Europe affects us here in the United States, and it’s important for us to take that global perspective as we discuss the economy.”
Another head & shoulders top that manifested in a significant sell-off in the equity markets occurred this past April. The current market correction was, in fact, preceded by a clear head & shoulders top to the February-April melt-up rally (see here). The bears will point to these two very recent instances of this technical formation to conclude that we’re headed to at least 940 on the S&P 500. Major support in this market sits at 940 as that technical level not only marks the neck line of the bottom of the financial crisis, but it is also the 50% Fibonacci retracement level of the entire 666 to 1221 rally. Below the 940 level, the only support in the market is all the way down to the bear market lows of 666.Support for the NASDAQ sits at 1900, and for the DJIA, 8856 is the first line of support if the neck-line is in fact breached. Finally, the bears will argue that significant weakness in the NASDAQ suggests that this sell-off is for real. It’s no secret tech stocks have lead this entire rally from the bear market lows to the April highs. Tuesday’s sell-off was lead primarily by weakness in tech, and more particularly, by weakness in the market’s biggest leader, Apple (AAPL).Throughout this entire correction, Apple has held up very well showing tremendous strength in the face of real weakness in the markets. Yet, Tuesday’s 4.5% sell-off suggests that the market is already beginning to shoot its leaders in the face, so to speak. When the market leaders go down that’s when investors should start to become concerned. As the NASDAQ is a weighted average, weakness in the stock had a sizable impact on Tuesday’s sell-off. While the DJIA and S&P 500 shed 3% of its value, Apple’s 4.5% sell-off lead the NASDAQ-100 (QQQQ) down 3.8%. Major weakness in Apple is highly suggestive that the market is headed for a sizable leg down. Though a very strong bear case suggests the market is headed lower perhaps to test support at 940 on the S&P 500, a very solid bull case can be made for the opposite conclusion. Last June, the bears learned a very valuable lesson about putting too much trust into technicals in general, and the head & shoulders formation in particular. While the head & shoulders formation does generally tend to lead the market lower, there are instances where the market completely reverses course and goes directly into full blown rally mode.
Last June, the market developed a noticeable head & shoulders formation. It become rather popularized, and was discussed at length among traders, the media, on message boards and among fund managers. The neck line of that head & shoulders was even broken on a significant high-volume sell-off. Hedge funds and traders were very short the market at the time. All signs suggested the market was about to take a significant leg down. Yet, the market completely reversed course and immediately went into a 60-day rally without so much as a pull back. I remember Art Cashin commenting on this reversal by saying, “the market will do what it can to make fools out of as many people as it can.” He went on to explain that because so many people were betting on this head & shoulders, that the slightest move up in the market lead to major short covering, which then turned into a sizable rally. It is last June’s reversal and Art Cashin’s comments that give me a great deal of reservation in remaining short the market right now.
However, a bear will argue that the current market is confronted with significantly different circumstances than the market in June 2009. For one, the June 2009 head & shoulders spanned only a number of weeks, which while bearish, isn’t quite as bearish as a head & shoulders top that forms over the span of 8 months. A bear will further argue that the fundamentals of the broader market in June 2009 are nowhere near as bearish as they are under the current environment. While I tend to agree with the bears in this case, I would rather stay in cash and look for buying opportunities if the market does in fact make its march down to 940 on the S&P 500. Instead of taking on the risk of a June-type reversal, I’m playing this next move on the market from the sidelines.