In early January 2008, I had a very troublesome conversation with my colleague at Matrix Analytix regarding a significant warning sign suggesting that a major crisis loomed on the horizon of the equity markets that year. The content of our conversation was focused on the implications of a massive one-year head & shoulders on the S&P 500 (SPY). The issue consistently pervaded my mind because if what the equity markets seemed to signal was true, we were probably headed for a major collapse. I remember asking him specifically, “Can this be for real? What are the implications of a head & shoulders of that magnitude completely unwinding?”
My colleague all but confirmed my concerns even pointing to a potential culprit for the impending downturn. He had noted that the markets had all but brushed off early warnings of systemic risk and liquidity concerns posed by the potential failure of subprime MBS’s that August, and that such concerns were likely to resurface in 2008. I, for one, didn’t really care what the potential culprit may be. For me, the fact that market technicals suggested that an impending failure was drawing near formed the basis of my concerns.
The fact that market participants, investors, and the mainstream media continued to put their heads in the sand and ignore such blatant signs of the broader market was simply unacceptable. At the time, the S&P 500 had rallied nearly 35% over the past 2 years. There was rampant discussion of Dow (DIA) 18,000 as the market continued to “benefit” from the so-called “Goldilocks economy.” Almost everyone was either oblivious to the warning signs of the broader market or simply decided to ignore them.
Turn the page to today, and it’s the same story all over again. While investors, fund managers, and the mainstream financial media debate whether we’re headed for a double-dip recession, they simply continue to disregard the obvious technical damage done on the broader market. Once again, this article is not so much concerned with the potential fundamental reasons or theories advanced as to why the markets might unravel. Instead, I’m more concerned with what the broader market seems to be telling me about the immediate future.
One can find no shortage of fundamental or mechanical theories explaining what might form the basis of a future financial collapse published at Zero Hedge, byNassim Nicholas Taleb, Nouriel Roubini or Karl Denninger. In fact, I buy into a lot of the evidence presented by these sources, and believe that one gains a better grasp of financial reality spending 10 minutes with Zero Hedge than spending 2 weeks listening to the mainstream financial media. It is laughable to compare the vacant dribble coming out of Dennis Kneale to even one single article published by Tyler Durden or Ryan Iskander.
Once again, right now I’m focused on what the trading activity in the broader market seems to be telling me rather than on what the fundamentals of the economy or the mechanical structure of the markets indicate. The techncials suggest, as they did in early 2008, that there is something fundamentally wrong with the financial markets and that a collapse, whatever the fundamental reasons may be, is potentially drawing near. There are seven issues I’ll briefly discuss below, and why its imperative that my readers should explore these issues in more detail.
1. Head & Shoulders on the S&P 500, Dow Jones, and NASDAQ
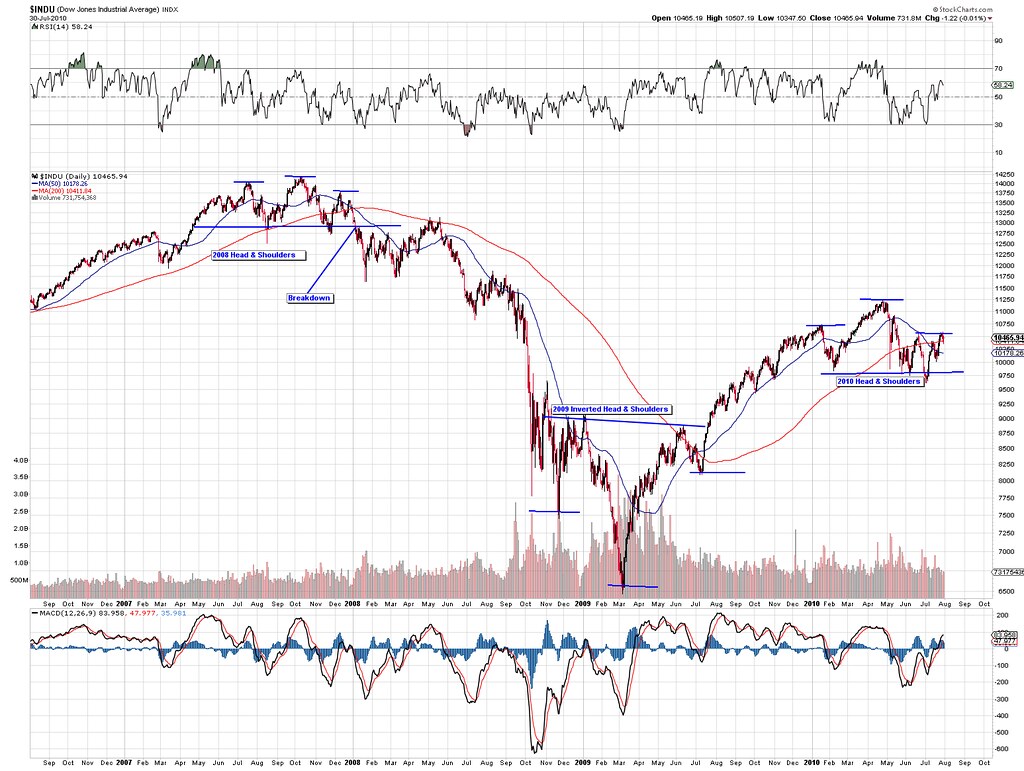
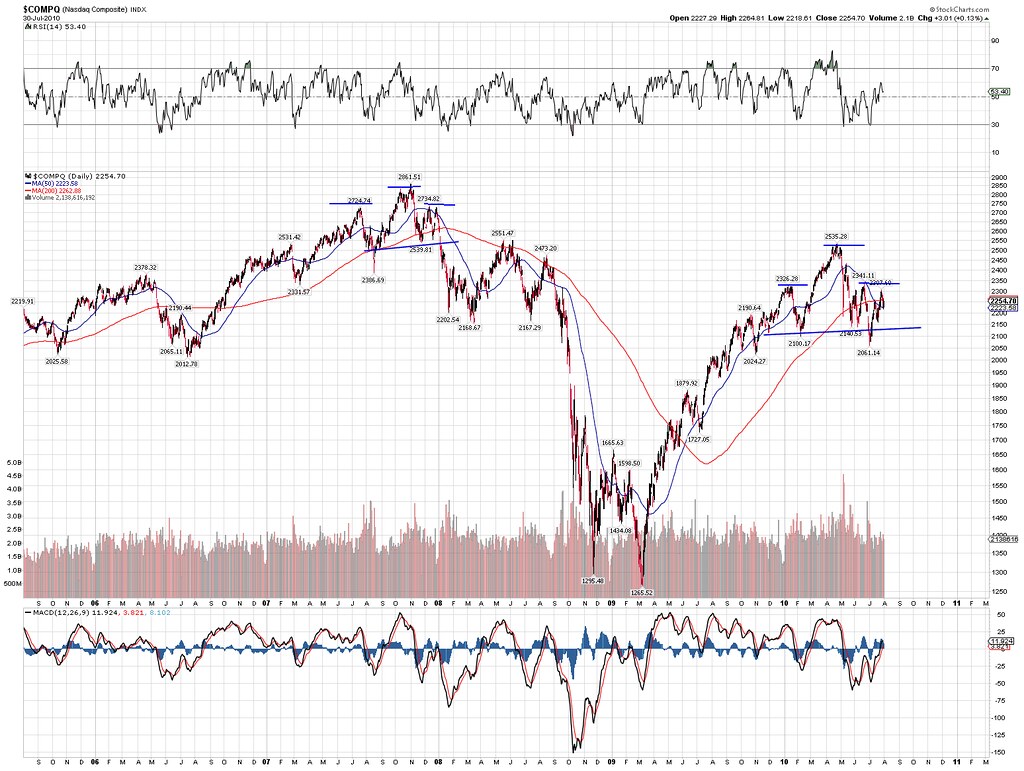
The biggest warning sign the market seems to be giving us right now is the blatant 10-month head & shoulders formation seen on each of the major indices. Like in 2008, a massive head & shoulders of this magnitude is not something that investors ought to take likely. Millions chose to ignore this warning sign in 2008 at their peril. I’m not going to sit here and belabor the point as I’ve already written extensively on this topic, which could be found here.
Yet, to summarize, a head & shoulders formation is arguably the most bearish technical formation in the books. The time, breadth and size of this head & shoulders is exactly the same as what we saw in early 2008 just before entering the biggest bear market in modern history. The neckline on this formation sits at around 1040 on the S&P 500. A substantial break below 1,000, the low of this current correction, could spell disaster for the broader markets. This is something worth watching. The long-term prospects of the market are completely in question until we see a rally above 1,220 on convincing volume.


2. Bullish Flag on the VIX?
Almost as important as the head & shoulders on every broad market index and exchange is the huge bullish flag on the VIX, $VXN and VXX (VXX). Volatility looks like its about to explode higher in the September to October time frame. A convergence of the upper and lower trend lines appears to take place near the end of August. This certainly does not bode well for the markets. An explosion of volatility can only be viewed as conclusively negative for the markets. We can’t have a massive spike in volatility without a coinciding collapse in the equity markets.
Yet, at the same time its possible that volatility can break out to the down side. A collapse in volatility could be very positive for a more stable equity market. It’s not uncommon to see bull flags fail to the down side. Still, a bullish flag is generally an indicator of higher price action in the future. Thus, one who chooses to ignore the obvious warning signs suggesting that we’re headed for bouts of high volatility in the near future does so at his or her peril.
3. The Death-Cross on the S&P suggests the 2009 to 2010 Rally might be Over
This topic has already been written about quite extensively over the past few weeks. As you may or may not be aware, the 50-day moving average crossed under the 200-day on the S&P 500 signaling that the March 2009 to April 2010 bull market might be at an end. When the 50 and 200 days cross in this manner, it suggests that the overall trend has weakened to such a degree that the recent price action is viewed as a topping process for the markets. We saw this exact same bearish cross on the S&P 500 in early January 2008 right at the start of the great bear market. You can read more about the death-cross here, here andhere.
4. The Volumeless Rally & Mutual Fund Outflows
Arguably one of the biggest warning signs suggesting that the entire 2009 to 2010 advance is just a bear market rally arises from the fact that the move was done on increasingly less volume. The clear lack of conviction indicates that the move was orchestrated by very few market participants. Some have advocated that the 2009 to 2010 rally was performed under the completely control of the federal reserve or by high frequency traders in either a ploy to combat deflation or by fixing the odds of the market to favor the very few. If Goldman Sachs posting gains every day in Q1 isn’t enough evidence that the game is fixed, I don’t know what is.
Every down move in the market is done on massive volume, and every up move on little to no volume. Each day of the February to April melt-up rally was easy to predict. When volume tanks, the market rises and volume picks up, the market tanks. What kind of no-conviction fraudulent market rallies on zero volume and tanks on heavy volume? Even the July bounce to this correction was done on low volume. Down days in July exhibited huge volume while up days saw declining participation.
This lack of conviction in the equity markets is further evidenced by the disconcertingly significant mutual fund outflows seen over the past year. Tyler Durden notes in an article posted at Zero Hedge last week, “The latest update from ICI is a doozy: in the week ended July 21, domestic equity mutual funds saw a 12th sequential outflow of $1.5 billion. Even as the market has surged 10% in the last three weeks, just under $10 billion have been redeemed from mutual funds, completely invalidating the move and further justifying the skeptics who see absolutely no reflection to reality in the volumeless ramp orchestrated by a few momentum HFTs and a couple of Primary Dealers with some excess leftover Discount Window change. Not to mention that 12 weeks in a row of outflows pretty much marks game over as far as retail participation is concerned in stocks."
Thus, until I see volume start to pick up during these July-type moves in the market, every indication suggests that the 2009 to 2010 rally in general, and the July rally in particular is complete horseshit. At the very least, there is overwhelming evidence indicating that something is broken in the pricing structure of the markets, and it will either have to work itself out through a minor collapse like the 2008 financial crisis, which could potentially bring in some real participation at distressed levels; or the markets will continue to move forward as they are and increase the risk of a real system collapse of the world financial markets.
5. 1,000 Point Flash Crashes
Adding to the concerns of low volume and mutual fund outflows, if 1,000-point inter-day swings in the Dow doesn’t raise a clear red flag to investors that the mechanics of the market is under fire, then clearly nothing can convince the average investor to consider caution in the coming months. Whether the so-called “flash-crash” was the result of some questionable “fat-finger” trade or the result of everyone putting in stop losses at the same level on the S&P (which I warned about 7-minutes prior to the crash see here) is anyone’s guess.
The fact that it occurred at all is by itself a cause for concern. There was apparently no fundamental reason behind the crash. Just 15 days earlier, the market was all honky-dory with its volumeless record rally, and so that inter-day crash can be attributed to a breakdown in market structure.
Yet, that breakdown is ongoing and has been ongoing as indicated by the backwards market that continues to rally on no volume and sells-off on heavy volume.The market technicals are telling us that its very possible that we could see another permanent flash crash sometime within the next few months. As we head into traditionally the weakest months of the year for the financial markets, only the profoundly fearless is very long this market. One who enters October 2010 very long shouldn’t be surprised if their account experiences cardiac arrest.
6. Bond Market Distrustful of the Rally
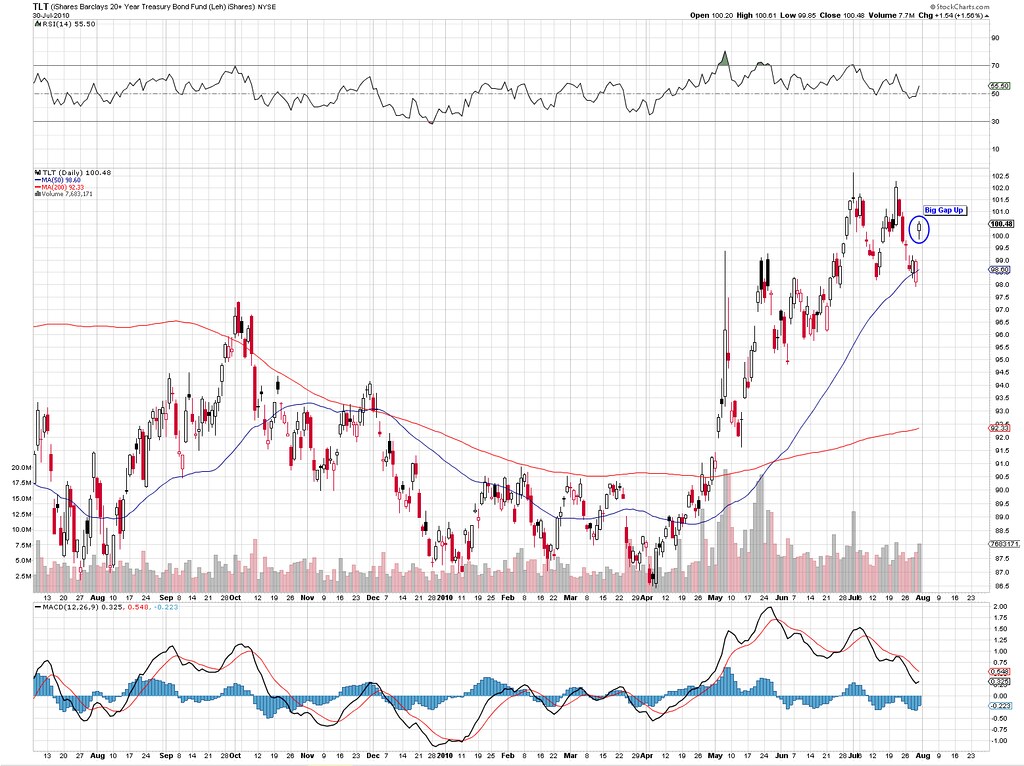
While the equity markets have rallied in July, the Bond market continues to be distrustful of this move in equities. Just on Friday, there was a complete decoupling between the move in the bond market and the move in the equity markets. Though the stock market rallied from its lows to close nearly flat on the day, yields continued to weaken and the TLT rallied into the close.
The $TNX, an index of the 10-year note yield, fell a whopping 3% on the day, all while equities closed flat! The $TNX traded near the lows session while equities rallied off their lows turning flat at the close. The TLT (TLT), which is a 20-year bond fund, not only gapped up at the open, but it closed near the highs of the day completely invalidating the move in the equities markets. The $TNX is sitting at a near 4-month low, the TLT at a near 4-month high, and yet the equity markets rallied nearly 10% in July? Something is clearly wrong with the equity markets.


7. Market Leadership is Weakening
Technology stocks (QQQQ), the market leader during the 2009 to 2010 recovery, continue to underperform the broader market. Apple (AAPL), the captain of the recovery, has reported two back-to-back blowout quarters yet continues to trade sideways to down over the past 4 months. Neither fiscal Q2 nor fiscal Q3 earnings reports have lead to any advances in Apple’s stock price suggesting that market leadership is starting weaken. Instead of leading the market higher, Apple, Microsoft (MSFT), Google, (GOOG), Intel (INTC), Cisco (CSCO) and other large cap bellwethers have been following, rather than leading the broader market. While Apple specifically has held up remarkably well in this correction, it barely participated in the July rally. In fact, industrial names have been leading the market lately, which is generally not a good sign for the overall market.
While this article lays out a very grim picture of the equity markets going forward, its important for investors to realize that the markets have rallied against bearish technicals in the past. Yet, the odds clearly favor the bears from a technical standpoint. A head & shoulders, while not bearish 100% of the time, is generally bearish most of the time. Unless you’re Goldman Sachs (GS) or J.P. Morgan (JPM), the most you can hope for is to bet with the odds. Right now, the probability suggests that the market is at very dangerous levels. Enough so that I’m generally either short the broader market or all cash.
Yet, those who know me know that I’m generally not a bearish journalist. I’m very neutral with respect to the markets. If the evidence weighs in favor of the upside, I’ll be long this market. In fact, I have traded calls a handful of times for some very handsome gains during this past correction. I’m neither a fan of the bulls nor a fan of the bears. I’m a fan of the evidence.
The most important thing I learned from spending three years at one of the forefront law schools in the country is that I have no opinions at all. That only the dictates of evidence should determine how I’m positioned in law or equity (no pun intended). At the same time, the facts are constantly changing, and if later evidence indicates that the coast is clear, you’ll be the first to see a long disclosure at the bottom of my articles. Yet, until that time, I would tread very carefully.
Disclosure: At the time of this writing, the author holds no position in the equity markets. The information contained in this column is not to be taken as either an investment or trading recommendation, and serious traders or investors should consult with their own professional financial advisors before acting on any thoughts expressed in this publication.