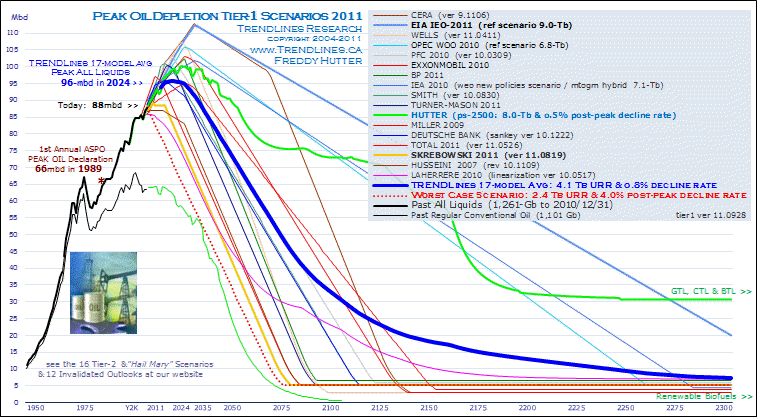
Consensus based on 17-model Tier-1 avg:
Peak Oil: 96 Mbd in 2024
Post-peak Decline Rate to 2050: 0.8%/yr avg
The year 50% of URR/EUR has been extracted: 2035
The year flow breaches below today's 88 Mbd: 2040
The year flow is 1/2 of today's 88 Mbd: 2086
The year we virtually run out of oil: 2283 (less than 8 Mbd & mostly BTL)
Global URR/EUR: 4,142 Gb (1,256 Gb consumed to 2010/12/31 excl 4 Gb BTL)
Today's Global Depletion: 30% of URR (Net Depletion Rate: 1.1%/yr)
Dec 28 2011 delayed FreeVenue public release of Sept 28th MemberVenue guidance ~ Today's monthly revision updates Tier-1 Outlooks by EIA, Chris Skrebowski & my own Hutter Peak Scenario-2500
Global production has increased dramatically from the Recession low of 83.1 Mbd (Jan/2009), setting yet another monthly record (88.4 Mbd) in July 2011. The 17-model average infers the oil sector is on pace to shatter last year's annual record and monthly production is poised to break the 90 Mbd threshold in 2014, the 95 milepost in 2020 & geologic peak should be pre-empted by Peak Demand of 96 Mbd in 2024. International Inventories are starting to dip below the 5-yr avg and 5% of global capacity is presently idle eagerly awaiting new Demand.
It is little known the pause in global production seen in 2009 was actually the 11th annual decline since 1975. The PS-2500 model incorporates similar disruptions during potential cyclical business cycle recessions in 2017, 2026 & 2034.
See our World Production Records venue for higher resolution charts of current extraction both at the global level and by the Top 7 nations. Historical analysis of Crude & Gasoline Price components & future target prices (out to 2035) can be viewed via our Gas Pump & Barrel Meter charts.
Today's Model Reviews:
The 2011 IEO update by EIA raises its 2035 Peak Rate by 1 Mbd to 112 Mbd. A valuable feature of the IEO is its annual forecast for the mix of primary electrical production expected for 2035.
This month's update reveals only 7% of the 2035 global mix will be solar, tide, geothermal & wind based. Let's repeat that for the tree-huggers among us: 7%. Adding hydro, Renewables are a mere 23% of the total tally. The balance is comprised of All Liquids 2%, Nuclear 16%. Natural Gas 22% & Coal 37%. Looking at global energy consumption in 2035, the breakdown is All Liquids (incl BTL) 29%, Coal 27%, Natural Gas 23%, Nuclear 7% & Renewables 14%.
Chris Skrebowski's 2011 update leaves intact his 2014 Peak Date based on his Megaprojects study, but departs on a new tack. This effort strangely builds on the failed economic forecasts by James Hamilton & Steven Kopits. In short, Skrebowski proposes All Liquids consumption will decline in 2015 due to irreversible demand destruction upon Crude Price exceeding $135/barrel.
Both Hamilton & Kopits confuse correlation with causation. Despite their McPeakster-like proclamations, high oil prices did not induce 10 of the last 11 American Recessions!
James Hamilton's (Univ of California) infamous Spring 2008 prediction of TEOTWAWKI was founded on McPeakster talking points and revealed himself as a neophyte with respect to even general knowledge of the oil sector when discussing Saudi Arabia, Underlying Decline Rate Observed (URDO) and Megaproject estimates. Debasement of the USDollar escaped the academic completely ... as did the concept of demand destruction.
OTOH, Steven Kopits (Douglas-Westwood) proved has limited knowledge of the latter factor by predicting in early 2011 at an appearance before the USA House of Representatives Energy Subcommittee (2011/2/18) an American and worldwide economic Recessions upon Crude Price exceeding $86/barrel.
Kopits is misguided with respect to the critical mass within the US economy. My own Gas Pump model had discovered in 2009 the USA auto sector can be decimated upon breach of a definitive Gasoline/GDP ratio signalled today by $3.26/gallon pump prices ($90/barrel oil) ... the Light Vehicle Sales Collapse Threshold. The BEA has confirmed (Q2 GDP 1.4%) even $113/barrel crude in April 2011 could not bring about an economic contraction.
Crude oil is a miniscule portion of the consumer price index in most nations and the breach of the $86/barrel threshold passed unceremoniously. The IMF reported in June 2011 that Q2 GDP was running at a robust 3.9% pace. The Barrel Meter model addressed this very forcing and found only when Crude Price attains the definitive Crude-Cost/GDP ratio represented currently by $116/barrel would there be headwinds sufficient to result in a new round of G-20 Recessions ... the G-20 Recessions Threshold.
Last year Skrebowski borrowed from PS-2500 by adopting a "future Megaprojects" variable into his model. Similarly this Summer, he has attempted to construct an economic module on loose application of my Thresholds factor. I am flattered but his efforts are completely misapplied.
A favourite contribution to this 17-model Depletion study is of course my Peak Scenario-2500. The only depletion model that publishes updates monthly, its current revision reflects six factors: (a) target for Underlying Decline Rate Observed (UDRO) by 2050 increases to 4.3% (from 4.0%); (b) the projected annual New Capacity trend to Year 2100 increased to 3.6 Mbd (from 3.3 Mbd); (d) to maintain the integrity of supply chain realities the model assumes Proved Reserves will continue to be developed from available resource at a rate consistent with the historic 40-yr Reserves/Production ratio; (e) in a quest to preserve the aspirational soundness of price discovery, global Surplus Capacity is prevented from dipping below 4 Mbd throughout the timeline; & (f) 4 Gb increase in URR/EUR.
In its early life, the PS-2500 model revealed the onset of terminal decline in a petroleum province is usually brought on by either (a) constraints in securing sufficient proved reserves at will on an annual basis, or (b) due to the magnitude of rising annual Underlying Decline Observed inevitably surpassing the annual New Capacity installations. Because it appears the potential capacity peak is being truncated by a waning growth rate in consumption, PS-2500 is currently monitoring two scenarios: Geologic PEAK & PEAK Demand.
The Geologic PEAK scenario assumes extrapolation of the 1 Mbd/yr production pace in play since 1970. The other reflects a sea change that occurred July 2010 when my newly implemented Peak Demand module began to detect a waning growth rate in long-term Demand. The module's feedback serves to explain the inability of Consumption to mop up the growing global surplus capacity in the system (6-mbd) at the end of the 2009 G-20 Recessions.
At this time, it appears Demand will peak @ 100 Mbd in 2029. Post-peak decline will average o.5%/yr during the following two decades. Conversely, when the PEAK Demand module is deactivated, PS-2500 projects there is sufficient capital, Proved Reserves & a demonstrated build rate for global production to attain 110 Mbd in 2037 (114 Capacity).
In tandem with the Barrel Meter module, Peak Scenario-2500 warns policy makers to target their strategies for transition away from gasoline/diesel transportation fuels to Year 2030, when Crude Price permanently breaches a definitive Crude-Cost/GDP threshold that historically decimates USA light vehicle manufacturing and sales.
The model gauges the pace of Underlying Decline Rate Observed @ 3.4% in 2011 and destined to rise to 4.3% by 2050. Its cyclical nature and projected performance can be viewed in a 1970-2050 (UDRO) chart. The model estimates 77 Mbd of the 120 Mbd of All Liquids Capacity added since 1970 addressed Underlying Decline Observed; and a further 90 Mbd is required to attain the 103 Mbd capacity target for 2035 in our PEAK Demand scenario: 12 to increase present capacity and 78 Mbd will address future UDO.
Visit our PS-2500 venue for lots more details and charts on non-conventional dynamics, Underlying Decline Observed & the inherent flaws (and myths) associated with the McPeakster fraternity.
Further to the 17 Tier-1 models, I regularly track 16 Tier-2 & Hail Mary outlooks. For discussion and posterity purposes, 4 Regular Conventional Oil projections & 11 Invalidated Outlooks are presented as well. But, it is the Average of the 17 Tier-1 models that offers up the very best guidance, such as:
Future Extraction Rates:
| 2008 | 85.6 | Mbd |
| 2009 | 84.4 | - |
| 2010 | 86.9 | - |
| 2011 | 87.6 | (pending) |
| 2024 | 96 | Peak Year & Peak Rate |
| 2033 | 93 | extraction passes 2 trillion |
| 2035 | 92 | 50% Extraction of URR |
| 2040 | 87 | first year flow is less than today |
| 2050 | 77 | milestone |
| 2052 | 76 | today's 1256-Gb of proved reserves exhausted |
| 2072 | 57 | extraction passes 3 trillion barrels |
| 2086 | 44 | flow is 1/2 of today |
| 2100 | 35 | milestone |
| 2111 | 30 | 100 yrs down the road... |
| 2200 | 13 | flows limited to X-Heavy, GTL, CTL & BTL |
| 2300 | 7 | flows limited to mostly renewable BTL |
Estimated Ultimate Recoverable Resource (EUR-URR)
The Avg URR/EUR Estimate for the 17 Tier-1 practitioners is 4,142 Gb when one deducts from the nominal average the volume attributable to renewable BTL (biofuels-to-liquid) as calculated by the Hutter Peak Scenario-2500 model. It estimates a cumulative 545 Gb BTL will have been produced thru to Year 2300. This net economic resource number compares remarkably well to the 3,991 Gb Avg derived by the 22 estimates within our similar URR Study with its slightly different mix of practitioners.
TRENDLines calculates Global Past Consumption (to 2010/12/31) to be 1,261 Gb for All Liquids of which 1,101 Gb is attributable to Regular Conventional Oil (light sweet crude) & 4-Gb to BTL.
Exhaustion of the first trillion barrels of All Liquids reserves occurred in 2002. Via the 17-model avg, the second trillion will have passed by Year 2033; then the third by Year 2072 (excl BTL). Annual flow will finally breach the 8 Mbd threshold in Year 2283 ... signifying the virtual exhaustion of fossil fuels. From that juncture, only BTL sourced renewable liquids along with the last vestiges of CTL provide Supply.
Of the Tier-1 model contributors, the lowest URR tally is the 2,560 Gb inferred in the PFC Energy Outlook. Highest is EIA's 9.0 Tb URR.
end of highlights - balance at original article