EQUITY CURVES
I have posted several articles recently about my modified version of Grossman's Global Rotation Strategy.
I have used the standard metrics to evaluate the system, including CAGR, standard deviation, maximum drawdown, and Sharpe rato. (Sorry, but Sortino gives me a headache.)
I also calculated a value that is similar to standard deviation but which measures the deviation of growth from a monotonic exponential curve. Very simply, I take the LN of returns and fit a straight regression line. Then I calculate the difference between each month's returns from the regression line at that month. I take the root mean square of these differences to arrive at what I call the "linearity" value.
You can see below that the linearity of the modified GMR system over the last 10 years is quite good:
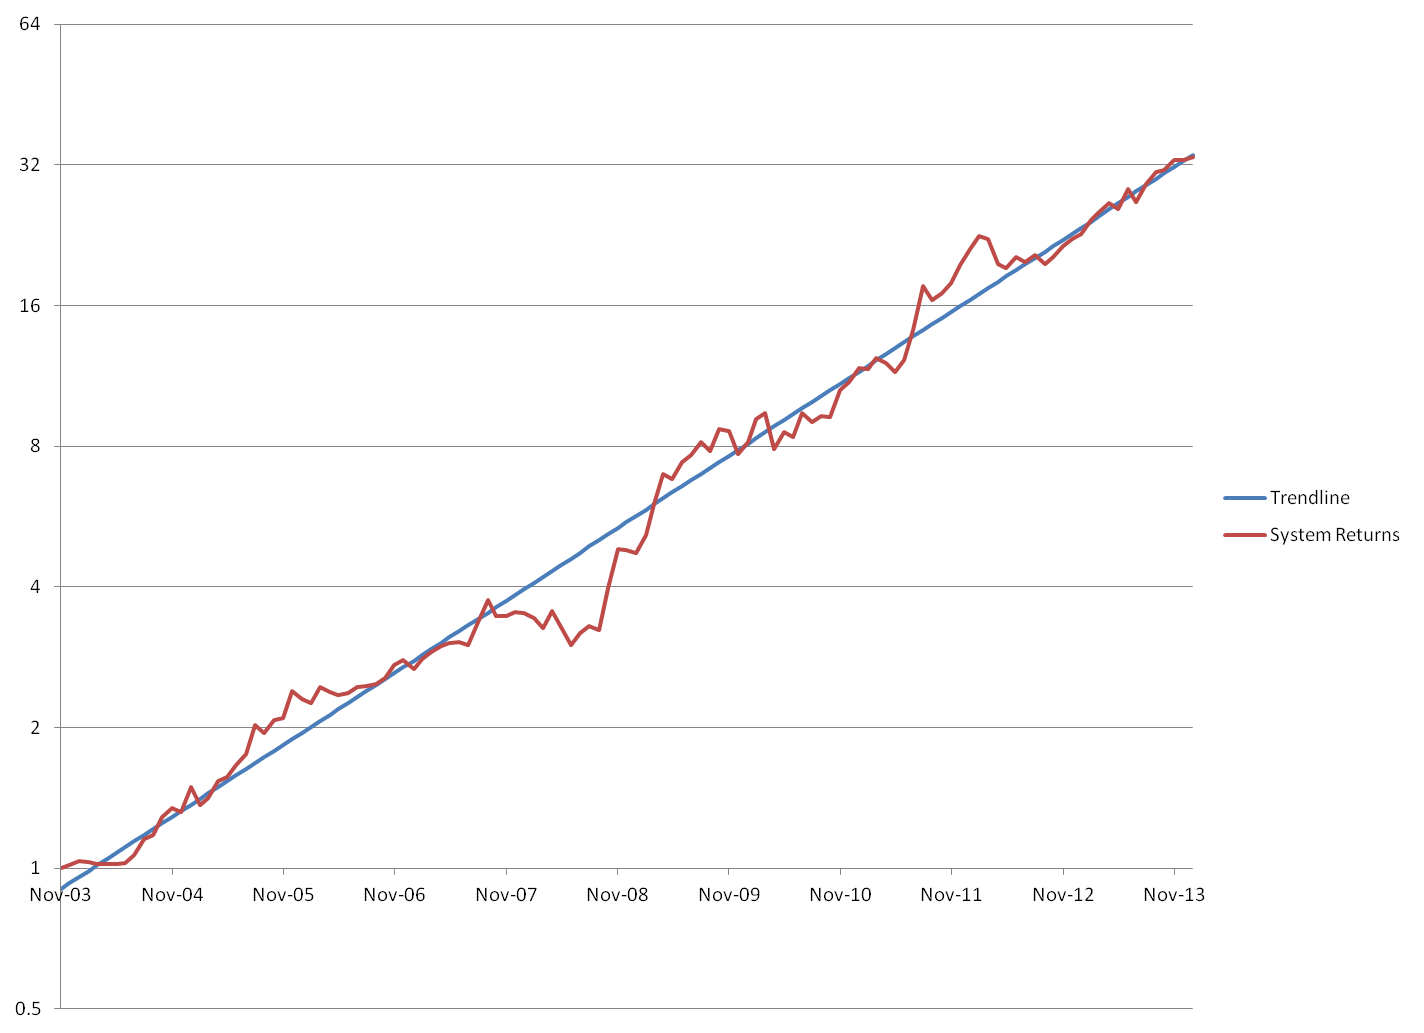
On an arithmetic scale, the returns look like this:
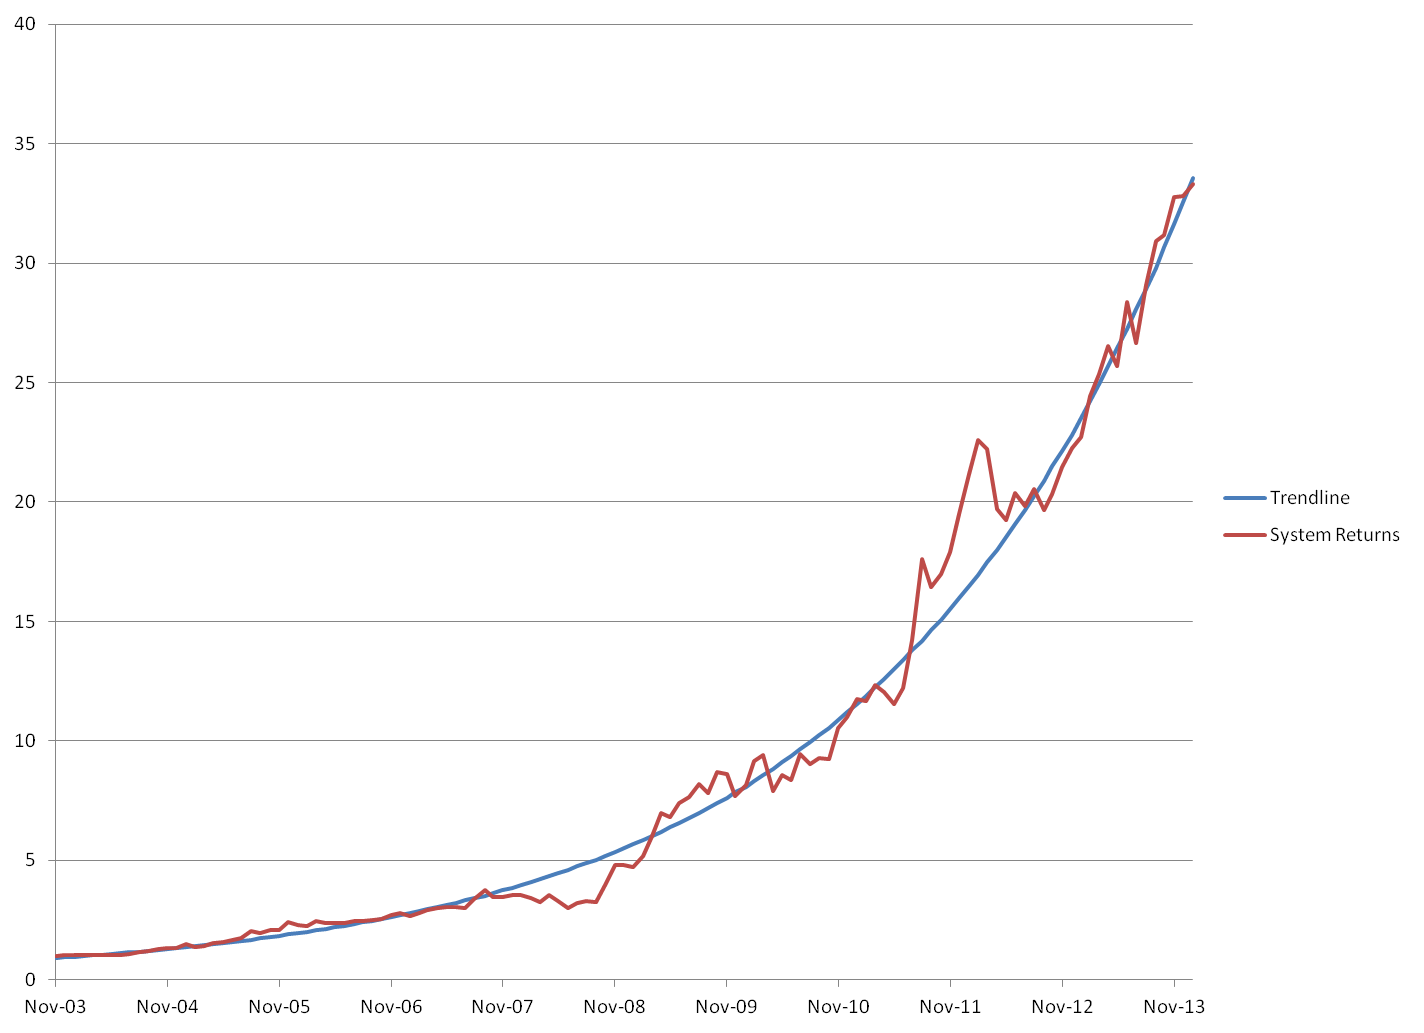
Again, we see quite monotonic growth.
The use of the linearity value was helpful now in optimizing the system some more. Or, actually, de-optimizing it, depending on your point of view.
As discussed in my previous blog post, the maximum returns were provided when the performance and volatility coefficients were 0.75 and 0.25, respectively, and the cash stop threshold was set at 0.75. The linearity value was 14.2% with these parameters.
I found, however, that the "linearity" value could be lowered with other parameters for the weights and cash stop threshold. But these lower values affected performance negatively. I needed to find a way to see the combination of these effects.
The New Sharpe* Ratio
To account for all this, I calculated a new ratio that I call the Sharpe* which is simply the CAGR of returns divided by the linearity value.
The best value for Sharpe* was achieved when the weights were 1.0 and 0.0 for performance and volatility, respectively. In other words, volatility increased the volatility, which makes sense when you consider that higher volatility increased the ranking. Any use of volatility at all in the system reduced the Sharpe* value. While the rate of return fell, the linearity increased by a greater proportion, thereby increasing the Sharpe* ratio.
I found that lowering the stop also improved the Sharpe* value. The optimal value of Sharpe* was achieved with the cash stop threshold at 0.5 (with the weights at 1.0 and 0.0 as above).
With these parameters, the Sharpe* value was a whopping 3.62 with a linearity of 11.1%. (By contrast, the S&P's Sharpe* value is 0.254 with a linearity of 28.9%.) The log of the equity curve and the fit line of my system is shown below:
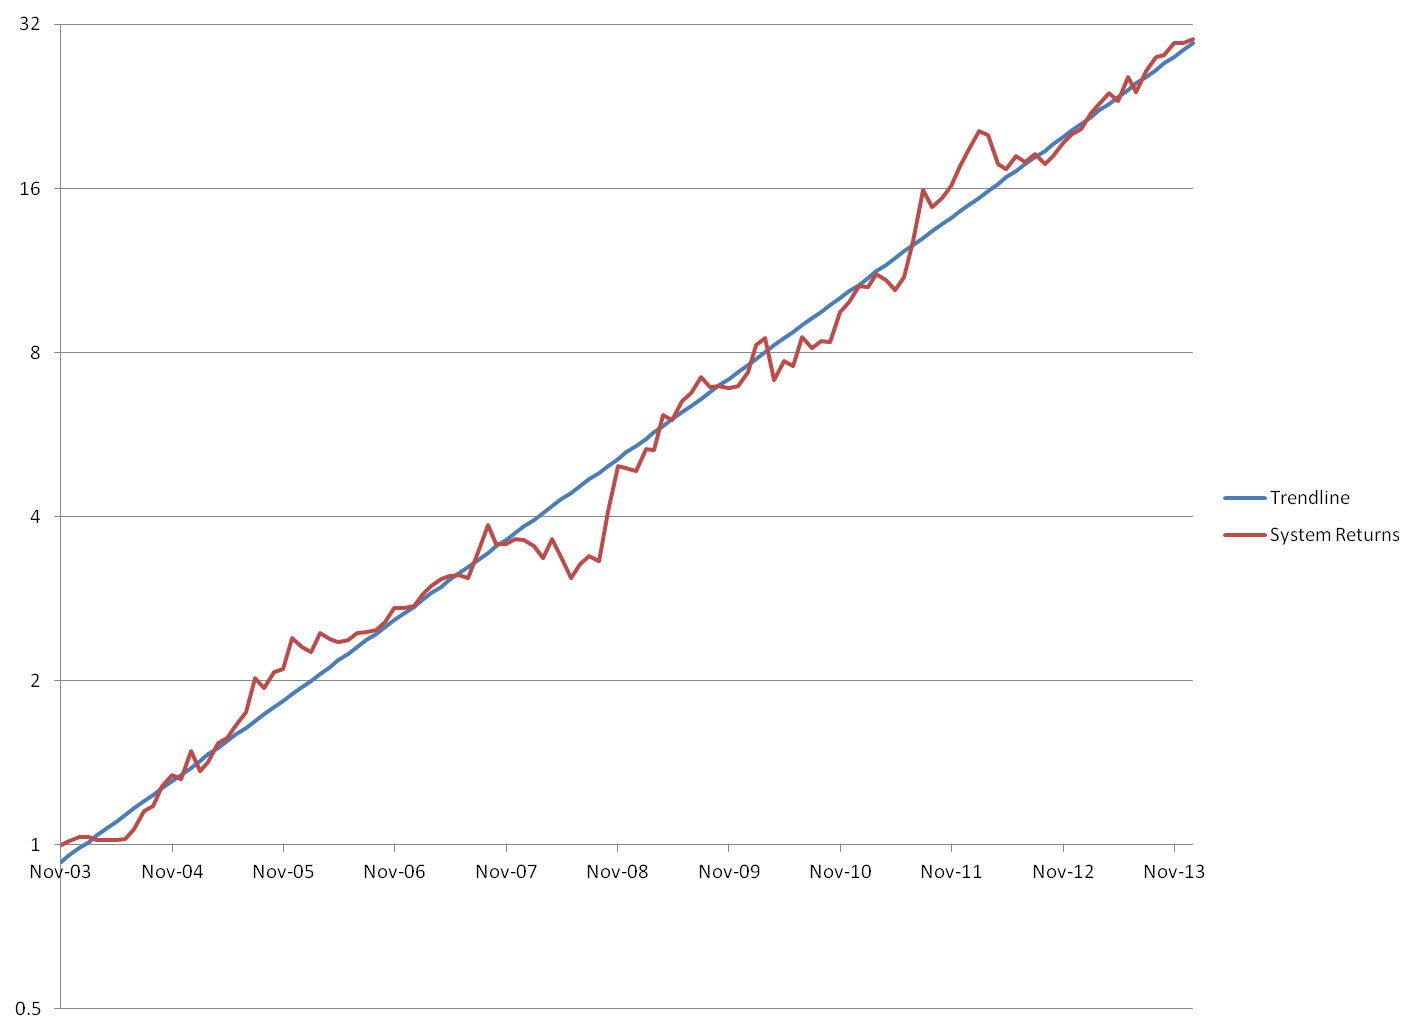
The 11% linearity is truly remarkable over a 10 year period.
Testing The Modified GMR Back 20 Years
One of the commenters on Grossman's original GMR article had professed to backtesting the system using similar Vanguard mutual funds for which price data was available into the early 1990s. He identified FDVLX (US), FIEUX (Europe), FEMKX (Emerging), FLATX (Latin), FPBFX (Pacific), and VUSTX (Long Bonds).
I found price data for these funds on Yahoo! Finance back to December 1993 and applied the system to this price data. For cash, I used SHY from inception in 2003 and a fixed dollar amount before then.
The system still beat the market handily but did not provide nearly the same returns as the version with modern ETFs. I suspect this may be due at least in part to the fact that the volatilities of the funds had a much larger variation than the ETF volatilities. For instance, the bond fund's volatility was less than half of the other funds, so I doubled the log of monthly performance for that fund only. This improved the performance of the system when applied the funds.
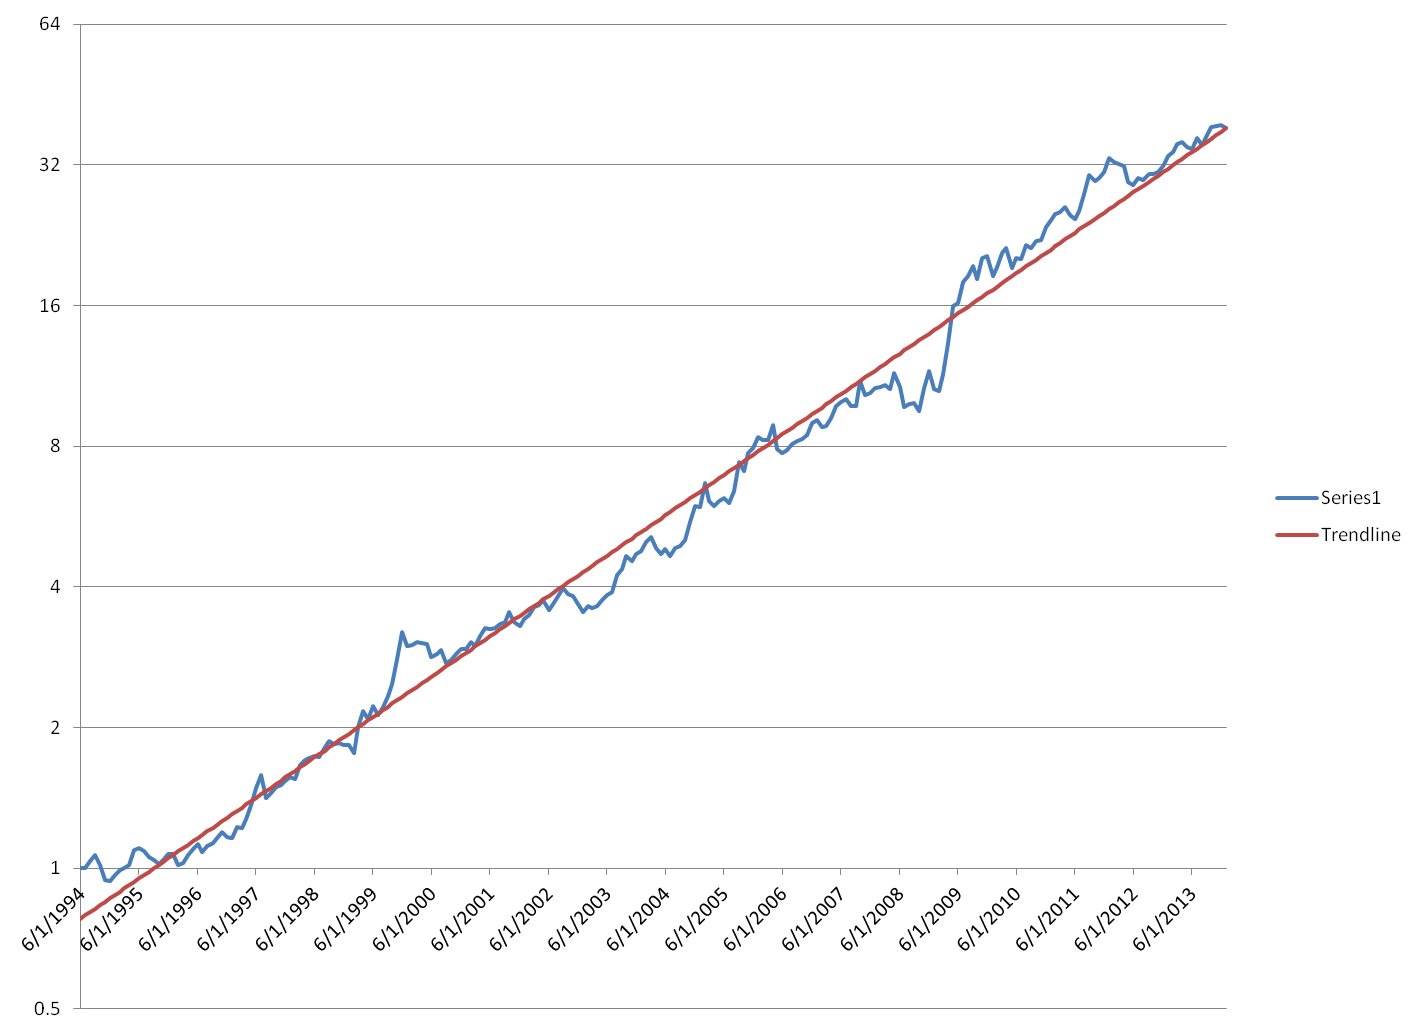
With no cash stop (threshold = 1) and only performance used for ranking (weights = 1.0 and 0.0), the system returned the following since Jan 31, 1994:
| Total | 38.34 |
| drawdown | 17.10% |
| stdev | 16.54% |
| CAGR | 20.00% |
| Sharp | 1.21 |
Although not as good as the recent ETF system, this is fantastic over 20 years, and I believe it confirms the economic hypothesis of the system.
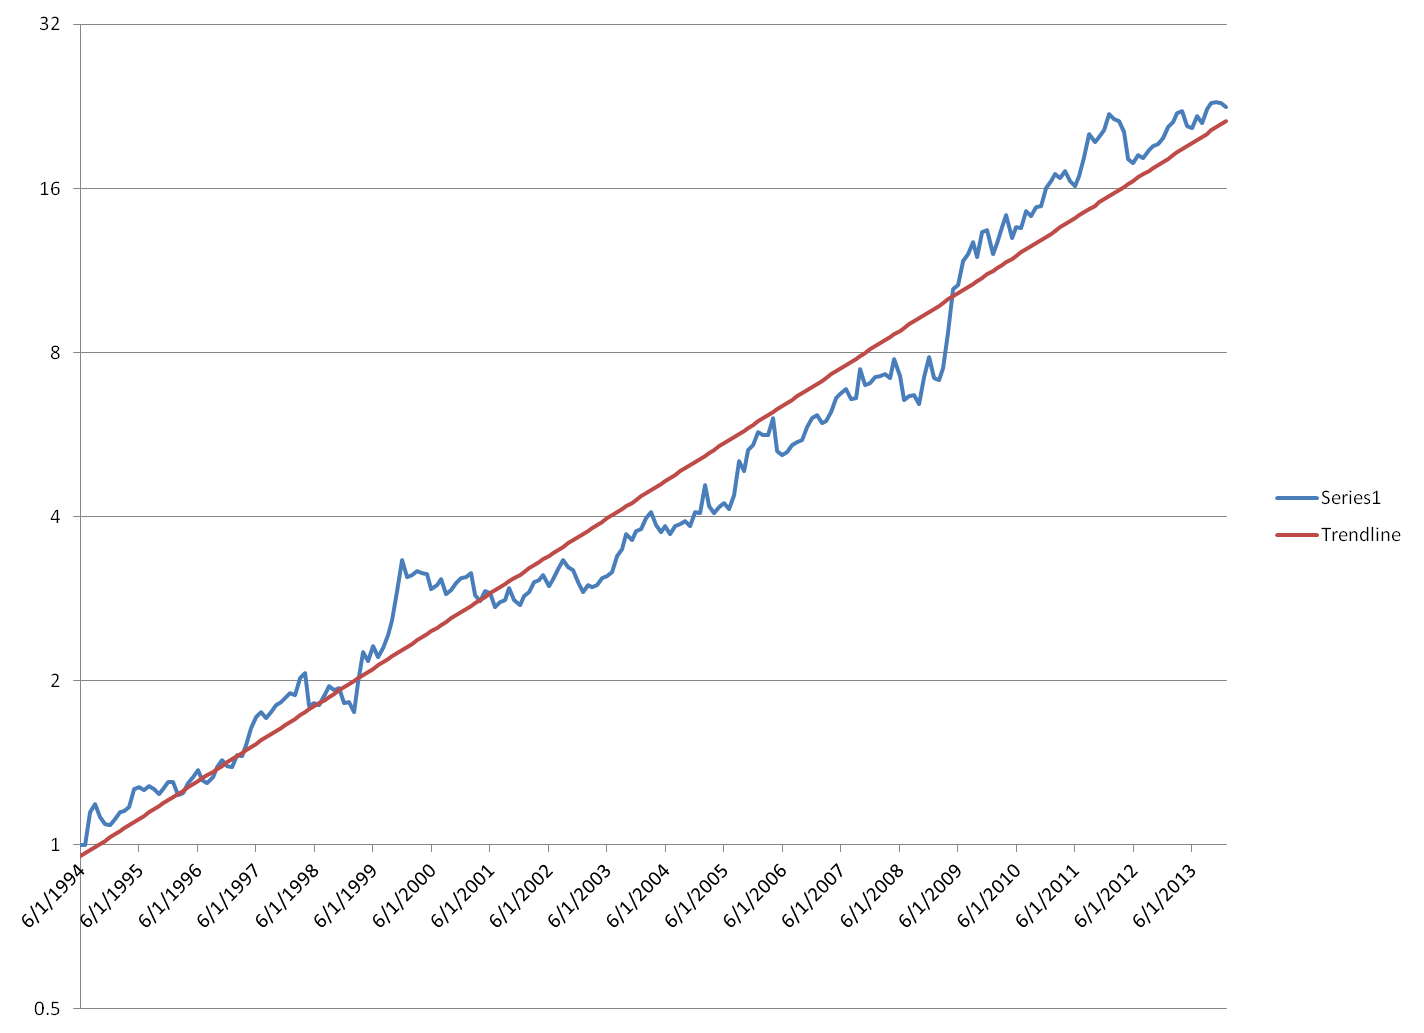
The equity curve for the fund-based system is below:
The use of volatility impairs performance significantly. When I use 0.75/0.25 for the performance and volatility weighs, results suffer:
| Total | 22.56 |
| drawdown | 18.60% |
| stdev | 17.37% |
| CAGR | 16.86% |
| Sharp | 0.97 |
You can see the increased choppiness in returns:
Again, still good for 20 years.
At the 1.0/0.0 weights, the linearity was 12.5% with a Sharpe* ratio of 1.65. At the 0.75/0.25 weights, the linearity was 16% with a Sharpe* ratio of 1.05.
Using the cash stop improved the Fidelity system as well, albeit marginally. With the 1.0/0.0 weights, the results with a cash stop threshold at 0.75 were:
| Total | 20.55 |
| drawdown | 17.30% |
| stdev | 15.56% |
| CAGR | 16.32% |
| Sharp | 1.05 |
Although returns were lower than with no cash stop, linearity was a mere 9.7% and the Sharpe* was maximal at 1.67.
From here, though, lowering the cash-stop threshold further gave worse results in a way that was not seen in the ETF system. For instance, if the stop was set to 0.5 (the optimal value for the ETF system) the results were worse:
| Total | 14.21 |
| drawdown | 17.10% |
| stdev | 14.68% |
| CAGR | 14.19% |
| Sharp | 0.97 |
Linearity was 15.5% and Sharpe* was 0.91.
I have no explanantion for why the cash stop operates at a different threshold for the mutual funds than for the ETFs. (But there are so many differences in these, that it should perhaps be more of a surprise that the system works on them at all.)
The year-over-year returns for the fund-based system with 0.75 cash stop is shown below compared to FDVLX. I have bolded the years in which the system beat the market.
| Delta v FDVLX | SYSTEM | FDVLX | |
| 1994 | |||
| 1995 | -17% | 10.41% | 27.15% |
| 1996 | -18% | -1.79% | 16.70% |
| 1997 | 1% | 22.38% | 21.24% |
| 1998 | 17% | 17.46% | 0.37% |
| 1999 | 2% | 10.39% | 8.67% |
| 2000 | -14% | -6.33% | 8.12% |
| 2001 | -2% | 10.31% | 12.26% |
| 2002 | 13% | 3.44% | -9.20% |
| 2003 | -15% | 18.98% | 34.43% |
| 2004 | 9% | 29.94% | 21.24% |
| 2005 | 19% | 33.67% | 14.26% |
| 2006 | -9% | 5.84% | 15.07% |
| 2007 | 20% | 22.15% | 2.22% |
| 2008 | 44% | -2.13% | -46.50% |
| 2009 | -11% | 33.59% | 44.10% |
| 2010 | 9% | 31.45% | 22.27% |
| 2011 | 43% | 36.12% | -6.71% |
| 2012 | -21% | 0.90% | 21.91% |
| 2013 | -21% | 16.08% | 37.08% |
Conclusions
Given these findings, I have decided to abandon volatility in the system. As Occam suggested, simpler is better. The performance-only system appears to provide the best results and the most robustness.
Further, given how poorly the 20-year system performed with the cash stop set at 0.5, I have determined that the optimal value of the cash stop for the ETF system should be 0.75, even though we saw a higher Sharpe* ratio with cash stop at 0.5. The difference is only very small as shown below and in fact the 0.75 system gives better returns:
Cash stop on ETF system at 0.75:
| Total | 33.33 |
| CAGR | 42.00% |
| Stdev | 23.56% |
| Drawdown | 19.88% |
| Sharpe v SPY | 1.47 |
| Sharpe v SHY | 1.69 |
Linearity of 12.8% and Sharpe* of 3.26
Cash stop on ETF system at 0.5:
| Total | 30.08 |
| CAGR | 40.55% |
| Stdev | 22.58% |
| Drawdown | 19.88% |
| Sharpe v SPY | 1.47 |
| Sharpe v SHY | 1.70 |
Linearity of 11.1% and Sharpe* of 3.62.
The modified GMR system appears to be incredibly rebust over a long period of time. The 20-year test confirms the economic principle behind the system. One can only cross our fingers for the future.
With the current settings, the year-over-year results of the ETF system since 2004 were:
| delta | SYSTEM | SPY | |
| 2004 | 23.68% | 34.37% | 10.70% |
| 2005 | 51.19% | 56.02% | 4.83% |
| 2006 | 13.76% | 29.61% | 15.84% |
| 2007 | 22.47% | 27.61% | 5.15% |
| 2008 | 75.54% | 38.74% | -36.80% |
| 2009 | 52.94% | 79.30% | 26.35% |
| 2010 | 7.06% | 22.12% | 15.06% |
| 2011 | 68.14% | 70.04% | 1.90% |
| 2012 | 3.90% | 19.88% | 15.99% |
| 2013 | 20.23% | 52.54% | 32.31% |
P.S. As I finish typing this, I realized that the figures for my ETF system above and throughout the article do include commissions of 0.04% per trade (i.e. $20 on $50,000). I am not going to go back and replace everything. Obviously, the system performs slightly better than what is shown if you can avoid commissions.
Disclosure: I am long SSO.