It is 2013, and this is the time to count the beans for 2012. Bloomberg published today: "Almost All of Wall Street Got 2012 Market Calls Wrong". Clearly, it would have made sense for these firms not to attempt actively managing asset allocation. If you aspire to do so, you should base your decisions on a tested model/method that has good accuracy.
Our model-based Stocks-Bonds strategy returned 18.8% in 2012, outperforming the 60/40 benchmark by 9.3%. The Stocks-Cash strategy outperformed by 5.5%.
1. How Strategies Work
We track tactical asset allocation/Benchmark Timing strategies that are based on PAR Model™ equity return forecasts. The exposure to the S&P 500 (SPY) is based on the model's return forecast. If the forecast is positive, the portfolio is invested in the equity index; if it is negative, it is invested in a low-risk asset class - bonds or cash.
The chart below presents the PAR Model's™ out-of-sample historical results since its inception in 2002. Buy and Sell signals indicate when the return forecast changed sign, which is when the model recommended buying or selling equity index.
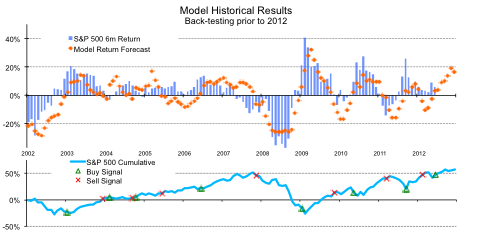
In 2012, the PAR Model™ gave a Sell signal on Feb 29th, and a Buy signal on Jun 30th. Not perfect timing, but reasonably good - within a month of the peak and the trough.
Two strategies are presented here: Stocks-Bonds(IEF) and Stocks-Cash. Both strategies switch 100% of portfolio to one of the two asset classes, based on the PAR Model's™ Buy or Sell signal. No leverage is used. Performance is presented starting from strategy inception on January 1, 2002, and for 1y and 5y periods (risk and IR are for 5y). Performance is net of average transaction costs of 0.1% bid-ask spread for stocks and 0.2% bid-ask spread for bonds.
Because most investors hold a balanced stock-bond portfolio, we use a benchmark that consists of 60% stocks and 40% bonds, rebalanced monthly.
2. Performance
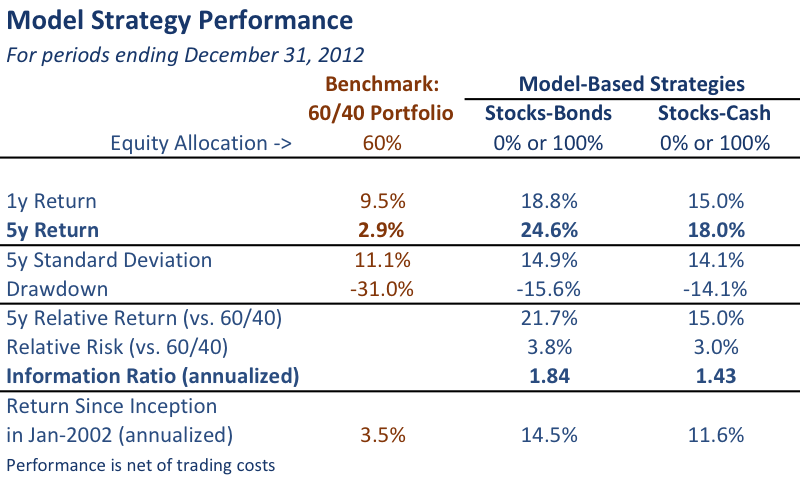
Both strategies performed very well in 2012, based on our real-time reporting of PAR Model™ results to clients. The Stocks-Bonds strategy returned 18.8% in 2012, outperforming the 60/40 benchmark by 9.3%. The Stocks-Cash strategy outperformed by 5.5% in 2012. Over five years, the two strategies outperformed the benchmark by annualized 21.7% and 15%, respectively.
3. Risk and Information Ratio
The Stocks-Bonds strategy adds 3.8% to annual volatility, while the Stocks-Cash strategy adds 3%. However, both strategies reduce downside risk (drawdown) by half relative to the 60/40 benchmark.
The Information Ratio is above 1.8 for the Stocks-Bonds strategy, and 1.4 for Stocks-Cash. These levels of IR indicate a high level of skill, and are typically consistent with top-decile manager performance.
Disclosure: I am long SPY.