The headlines say the durable goods new orders declined in August. This was all because July's spike in aircraft orders distorting the month-to-month evaluation. If you exclude civilian aircraft, durable goods were up month-over-month.
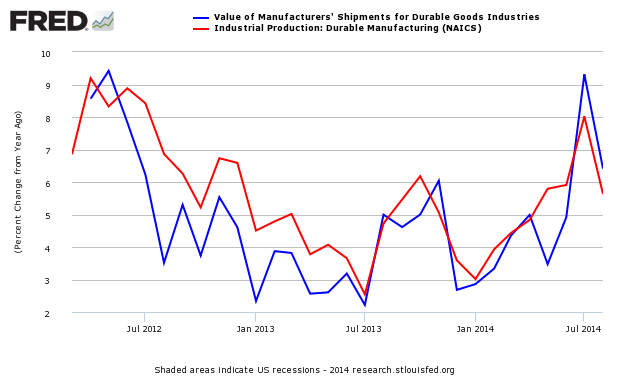
Further, durable goods is growing over three times as fast as GDP when you compare growth on a year-over-year basis. The only negative is that the Federal Reserve's Durable Goods Industrial Production Index declined in August throwing some doubt on the validity of the data - however this is a slightly different pulse point that correlates over time (and not necessarily in a single month)..
Econintersect Analysis:
- unadjusted new orders growth decelerated 29.7% ( after accelerating 34.2% the previous month) month-over-month , and is up 7.4% year-over-year.
- the three month rolling average for unadjusted new orders accelerated 2.1% month-over-month, and up 15.8% year-over-year.
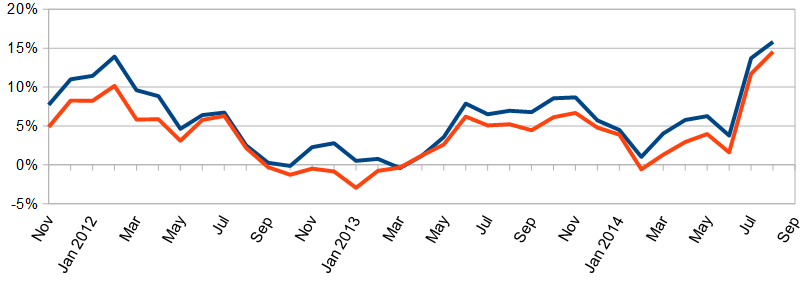
- Inflation adjusted but otherwise unadjusted new orders are up 7.1% year-over-year.
- The Federal Reserve's Durable Goods Industrial Production Index growth decelerated 4.4% month-over-month, up 5.3% year-over-year [note that this is a series with moderate backward revision - and it uses production as a pulse point (not new orders or shipments)] - three month trend is decelerating.
- unadjusted backlog (unfilled orders) growth accelerated 0.7% month-over-month, up 13.1% year-over-year.
- according to the seasonally adjusted data, civilian aircraft new orders was the major headwind month-over-month after growing 318% last month. Computer related products were also weak. Most other areas grew moderately month-over-month.
- note this is labelled as an advance report - however, backward revisions historically are relatively slight.
- new orders down 18.2% (after growing 22.6% the previous month) month-over-month.
- backlog (unfilled orders) was up 0.6% month-over-month - and remains at a historical high.
- the market expected:
| Consensus Range | Consensus | Actual | |
| New Orders - M/M change | -20.0 % to 3.5 % | -17.1% | -18.2% |
| Ex-transportation - M/M | 0.2 % to 2.0 % | 0.8% | 0.7 % |
Durable Goods sector is the portion of the economy which provides products which have a utility over long periods of time before needing repurchase - like cars, refrigerators and planes.
Econintersect concentrates on new orders as it is the entry point for future production - and somewhat intuitive economically. Using this pulse point, the economy is doing fairly well.
Other Economic News this Week:The Econintersect Economic Index for September 2014 is showing our index declined from last months 3 year high. Outside of our economic forecast - we are worried about the consumers' ability to expand consumption although data is now showing consumer income is now growing faster than expenditures growth. The GDP expansion of 4.2% in 2Q2014 is overstated as 2.1% of the growth would be making up for the contraction in 1Q2014, and 1.4% of the growth is due to an inventory build. Still, there are no warning signs that the economy is stalling.
The ECRI WLI growth index value has been weakly in positive territory for almost two years. The index is indicating the economy six month from today will be slightly better than it is today.
Current ECRI WLI Growth Index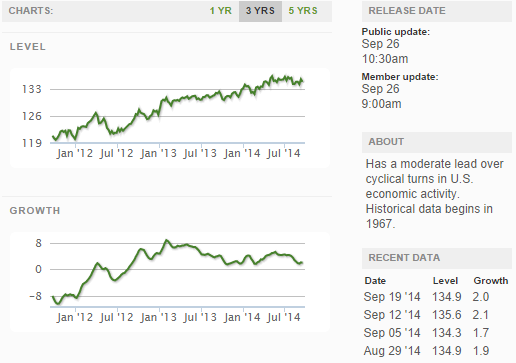
The market was expecting the weekly initial unemployment claims at 299,000 to 310,000 (consensus 300,000) vs the 293,000 reported. The more important (because of the volatility in the weekly reported claims and seasonality errors in adjusting the data) 4 week moving average moved from 299,750 (reported last week as 299,500) to 298,500.
Weekly Initial Unemployment Claims - 4 Week Average - Seasonally Adjusted - 2011 (red line), 2012 (green line), 2013 (blue line), 2014 (orange line)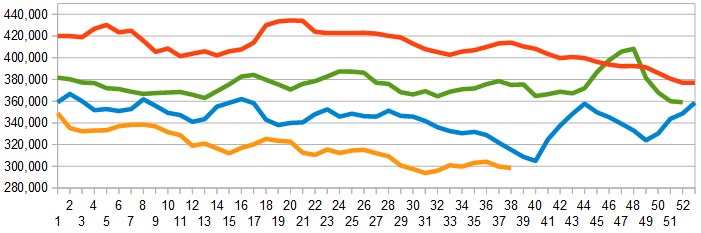
/images/z unemployment.PNG
Bankruptcies this Week: Privately-held ITR Concession Company, ISC8 (fka Irvine Sensors Corporation), Vision Industries
[click on image below to view all the analysis this week]