What a wonderful jobs report this past week. Even though it is a rear view mirror of the economy - it confirms the economy has been growing strongly. And history has shown that unless there is a precipitating event (say 1972), economic declines are as gradual as economic growth.
A big consumer based economy like the USA does not take off like a rocket or fall off a cliff. I know most pundits believe this growth spurt we see in hindsight will continue - but I believe there is higher probability of a slowing of growth in 2015 then a continuing of the growth we are seeing.
Why?
Some data elements have limited forward vision as they become final sales several months from now. Take November 2014 Census Manufacturing new orders where the rate of growth has declined for four months in a row. Last Friday, wholesale sales fell dramatically and inventories grew - far from a good sign. I always warn NEVER to take a single data point and run - this could be an anomaly.
The headlines say wholesale sales declined and inventories grew. This data series is very noisy, and continues on a roller coaster of good and bad data. Because of this noise, the best way to look at this series may be the unadjusted data three month rolling averages which decelerated for the fourth month in a row. The data for wholesale trade was terrible this month but it could have been caused by a changing seasonal demand.
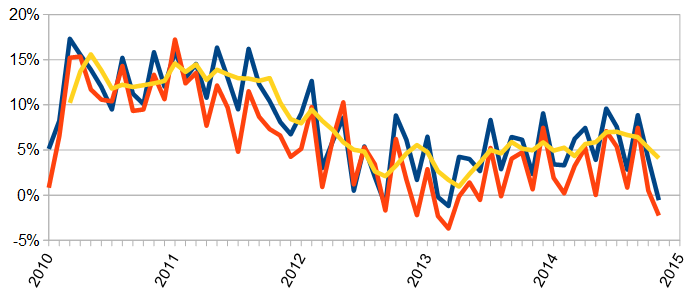
The unadjusted rolling averages seem a little soft this month - but it could just be a new change in wholesale and associated warehousing for the holiday season. [note that Econintersect analysis is year-over-year - so that the analysis is based on the change from one year ago.] Econintersect Analysis:
- unadjusted sales rate of growth decelerated 4.5% month-over-month (last month was a revised 4.9%)
- unadjusted sales year-over-year growth is down 0.6% year-over-year
- unadjusted sales (but inflation adjusted) down 2.3% year-over-year
- the 3 month rolling average of unadjusted sales decelerated 1.1% month-over-month, and up 4.1% year-over-year (September was a very high growth month which affected the averages).
/images/z%20wholesale1.PNG
- unadjusted inventories up 7.1% year-over-year (accelerated 0.2% month-over-month), inventory-to-sales ratio is 1.29 which is historically is well above non-recessionary periods for Octobers.
US Census Headlines based on seasonally adjusted data:
- sales down 0.3% month-over-month, up 2.4% (last month was reported 4.3%) year-over-year
- inventories up 0.8% month-over-month, inventory-to-sales ratios were 1.16 one year ago - and are now 1.21.
- the market expected inventory month-over-month change between -0.3% to +0.7% (consensus 0.3%) versus the +0.8% reported.
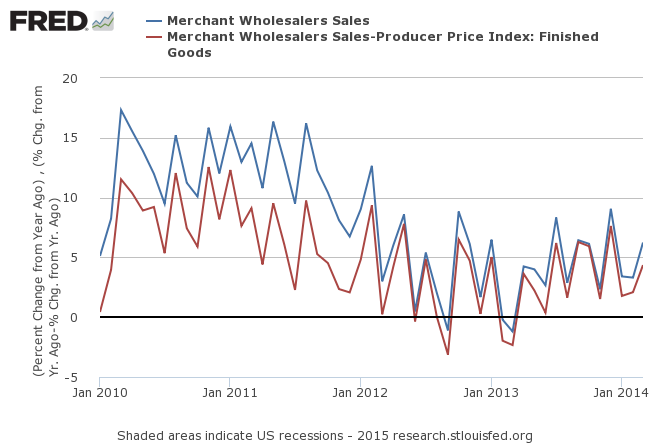
The short term year-over-year trend for sales is now fluctuating.
Wholesale Sales - Unadjusted - $ Millions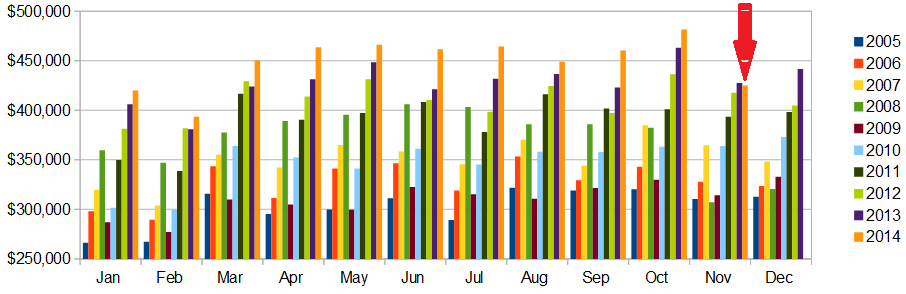
/images/wholesale_2005on.PNG
Wholesale sales have now been at record highs for almost two years - until this month where they contracted year-over-year. Overall, the inventory-to-sales ratios (a rising ratio is an indicator of economic slowing) was abnormally high relative to past Novembers. The graph below however shows the change in the ratios from a year ago - and any number above zero is good.
Unadjusted Inventory-to-Sales Ratio (blue line) Year-over-Year Change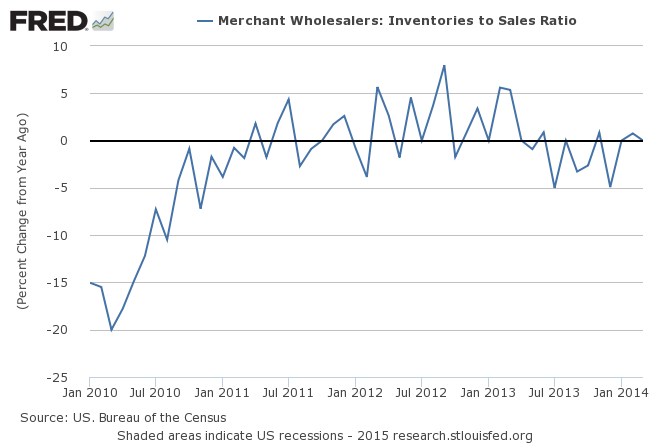
Year-over-year change in the inventory-to-sales ratio is what is important - and this month it jumped up - a jump in the ratio which could indicate a slowing economy (one month of data is not a trend). A flat trend would indicate an economy which was neither accelerating or decelerating. A decelerating trend would indicate an improving economy.
Other Economic News this Week:The Econintersect Economic Index for January 2015 is showing our index is midrange in a tight growth range for almost a year. Although there are no warning flags in the data which is used to compile our forecast, there also is no signs that the rate of economic growth will improve. Additionally there are no warning signs in other leading indices that the economy is stalling - EXCEPT ECRI's Weekly Leading Index which is slightly below the zero growth line. There have been some soft data point which caused our index to decline this month - but none of them are currently show the 3 month rolling averages declining.
The ECRI WLI growth index value crossed slightly into negative territory which implies the economy will not have grown six months from today.
Current ECRI WLI Growth Index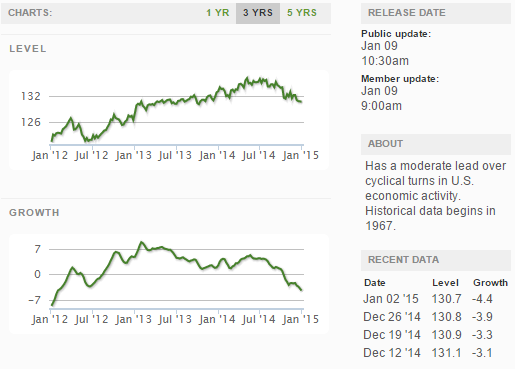
The market was expecting the weekly initial unemployment claims at 280,000 to 297,000 (consensus 290,000) vs the 294,000 reported. The more important (because of the volatility in the weekly reported claims and seasonality errors in adjusting the data) 4 week moving average moved from 290,750 (reported last week as 290,750) to 290,500. Rolling averages under 300,000 are excellent.
Weekly Initial Unemployment Claims - 4 Week Average - Seasonally Adjusted - 2011 (red line), 2012 (green line), 2013 (blue line), 2014 (orange line), 2015 (violet line)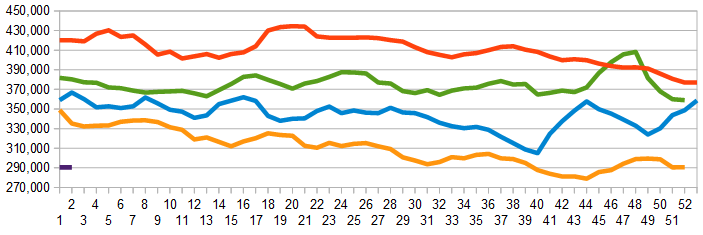
Bankruptcies this Week: Tengion
To view all of out analysis this week [click here].