Retail sales improved according to US Census headline analysis. Our view is that this month's data was weaker than last month, There was a small decline in the rolling averages. Consider that the headline data is not inflation adjusted and prices are currently deflating making the data better than it seems.
Econintersect Analysis:
- unadjusted sales rate of growth decelerated 1.6 % month-over-month, and up 1.4 % year-over-year.
- unadjusted sales 3 month rolling year-over-year average growth decelerated 0.1 % month-over-month, 2.0 % year-over-year.
/images/z retail1.png
- unadjusted sales (but inflation adjusted) up 2.0 % year-over-year
- this is an advance report. Please see caveats below showing variations between the advance report and the "final".
- in the seasonally adjusted data - auto sales, sporting goods, non-store retailers, and food services were strong. Gas stations, appliance stores and department stores were weak.
- seasonally adjusted sales up 0.1 % month-over-month, up 3.4 % year-over-year (last month was 2.1 % year-over-year).
The differences between the headlines and Econintersect are due to different approaches to seasonal adjustment (see caveats at the end of this post). Long and medium term trends always agree comparing the adjusted to the unadjusted data - it is the short term trends and month-over-month change where the conflict occurs.
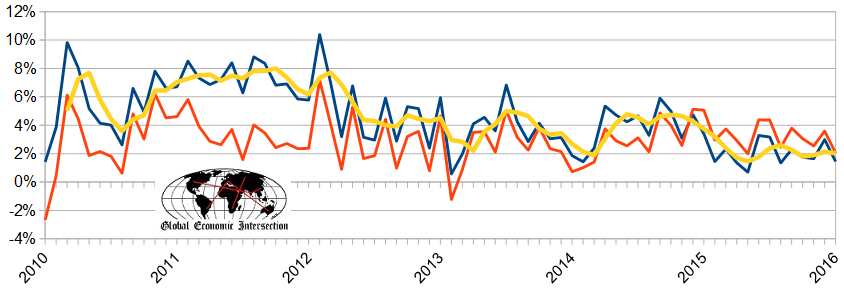
Comparison of the Year-over-Year Census Seasonally Adjusted Retail Sales (blue line) and Econintersect's Unadjusted Retail Sales (red line)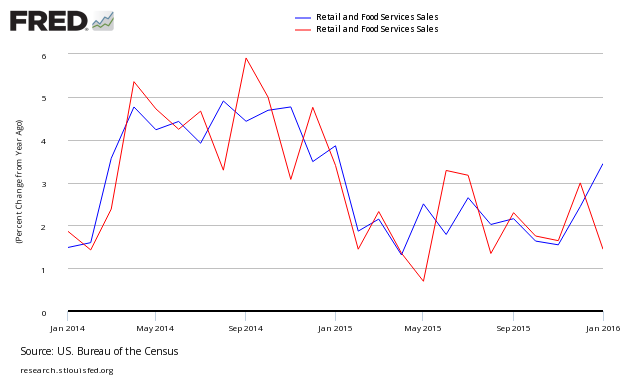
Retail sales are far from recessionary, and continue to show that the consumer segment of the economy is alive and kicking.
Other Economic News this Week:
The Econintersect Economic Index for February 2016 declined again, and is barely positive - and still remains at the lowest value since the end of the Great Recession. The tracked sectors of the economy which showed growth were mostly offset by the sectors in contraction. Our economic index remains in a long term decline since late 2014.
Current ECRI WLI Growth Index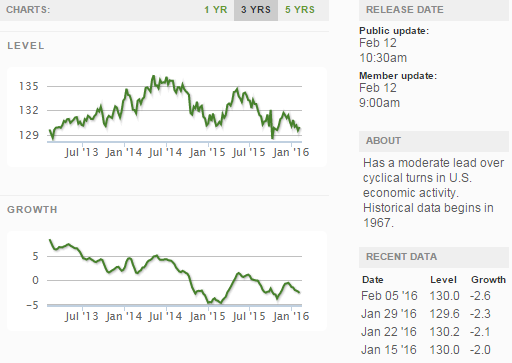
The market (from Bloomberg) was expecting the weekly initial unemployment claims at 272 K to 290 K (consensus 281,000) vs the 269,000 reported. The more important (because of the volatility in the weekly reported claims and seasonality errors in adjusting the data) 4 week moving average moved from 284,750 (reported last week as 284,750) to 281,250. The rolling averages generally have been equal to or under 300,000 since August 2014.
Weekly Initial Unemployment Claims - 4 Week Average - Seasonally Adjusted - 2011 (red line), 2012 (green line), 2013 (blue line), 2014 (orange line), 2015 (violet line)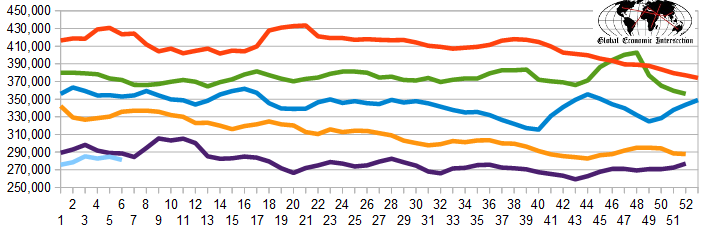
Bankruptcies this Week: Noranda Aluminum Holding, Privately-held Sundevil Power
Please visit our landing page for all of our analysis this past week.