Excerpt From: Global Seasonal Analysis
Asset Class: Gold Prices
Date: August 30th 2013
The green bar on the chart identifies September as the seasonally strongest month of the year for gold prices (London PM fixing) since 1977. It represents the second of a five-month period of mostly seasonal strength that extends through year end, but is interrupted by one month of acute seasonal weakness in October, the 2nd weakest month during this 35-year period.
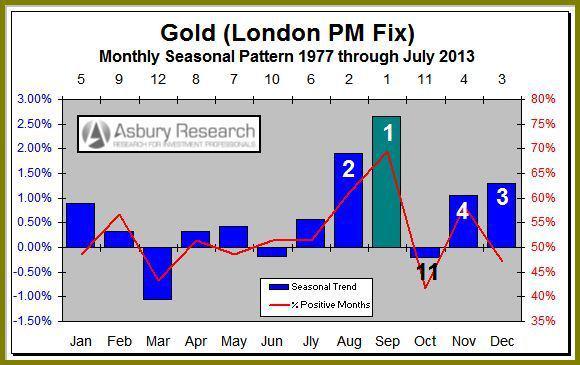
The height of the green bar on the chart indicates that, on average since 1977, gold prices have risen by 2.65% in September. The red line shows that, also on average since 1977, gold prices have posted a positive monthly close 69% of the time in September, which is the yellow metal's highest incidence of a positive close for any month during this period.
continued…
-----------------------------------------------------------------
In our July 23rd Research Excerpt, entitled Gold Prices Test Their First Upside Obstacle: Watch The Smart Money, we pointed out that commercial hedgers, a.k.a. the "smart money", were collectively holding their most bullish net position in COMEX gold since 2002. June 2002 evolved into a major bottom in gold prices that preceded them quadrupling by late 2011.
Since June 23rd, COMEX gold has already risen by $86 per ounce or 6.4%.
Today's chart shows that, with the exception of a sharp one-month decline during October, 35 years of seasonality data supports the commercials' bullish position in gold futures via overall seasonal strength from August into January.
Asbury Research subscribers can view our entire August 30th report by visiting our Research Center.