Once in a blue moon I stumble across a document chock full of relevant material. Such is the commercial real estate (CRE) market Congressional Oversight Report (COR) produced by a committee chaired by Elizabeth Warren. Much of the source and chart material I provide is from this well-written report.
![]()
Most CRE lending is concentrated in commercial banks and asset-backed securities issuers (CMBS); but other players, including the government and insurers, are involved. CMBS issuance is at $709 billion.

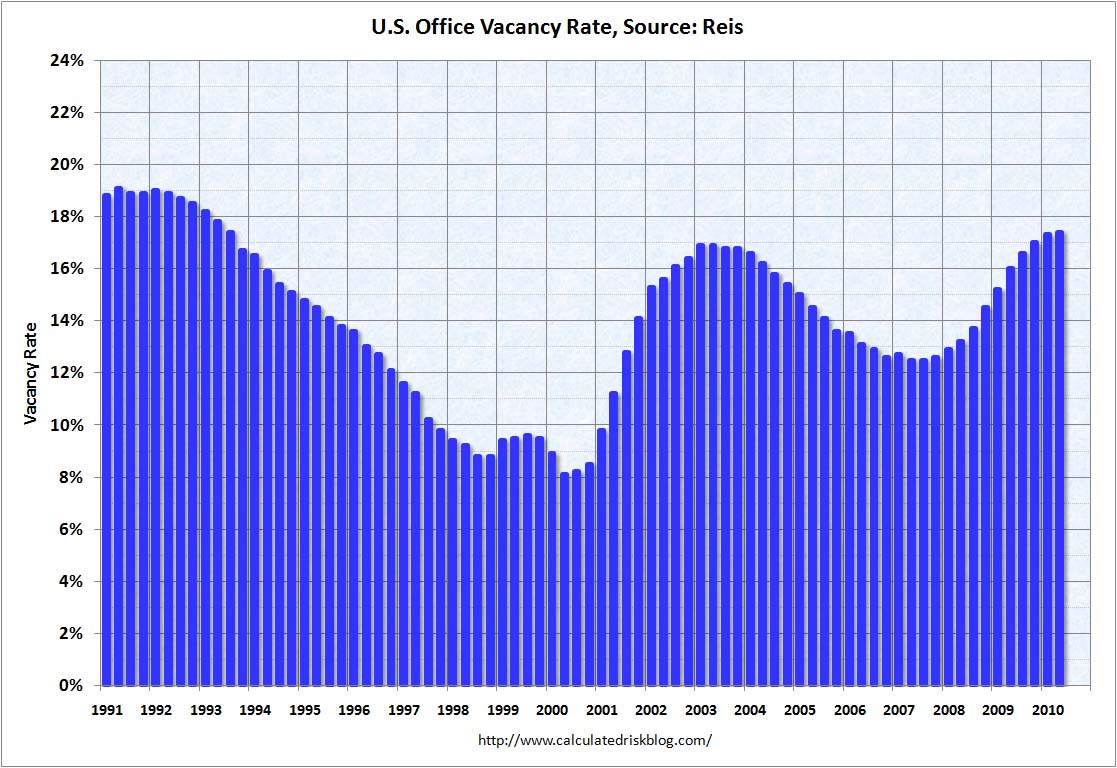
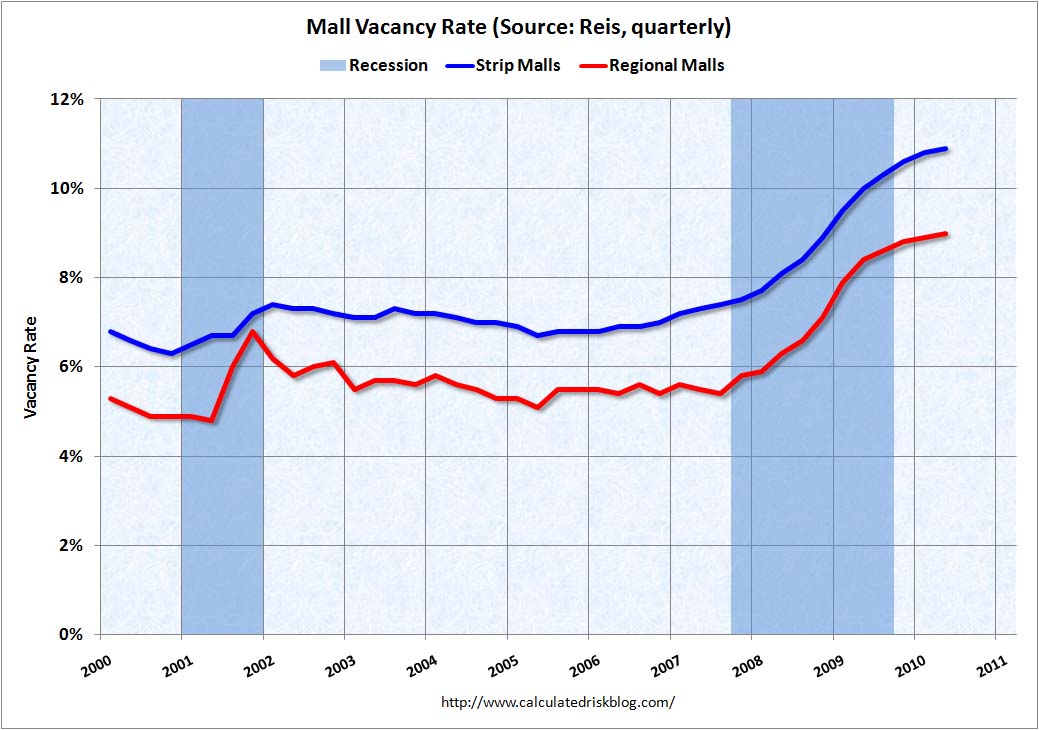
We see about two-thirds of the commercial mortgage backed securities (CMBS) portion in the office and retail sectors.

Even during the boom period, retail and office vacancy rates were never that robust, but the loans were made anyway. Now things are ugly and getting worse. In general, rents in CRE are down five to 10 percent.
During the third quarter of 2007 alone, and at the very peak of the CRE cycle, 28 percent of CMBS were originated. There is little or no amortization cushion built up, as about 85 percent of these are interest only (IO) or partial IO loans.

A common form of CRE financing is a term balloon that is usually the five years but sometimes seven. Most CRE uses 25 percent equity financing, although now banks want at least 30%. The other key factor to consider is the origination date (vintage) applied to the maturity schedule. Referencing the price index chart below, we can calculate the overall capitalization situation of CRE. Anything between 1.2 to 1.4 on the index ( as the 2004 vintage), means there might be a little equity left but it would still be badly under capitalized. Between 1.4 to 1.6 such as for the 2005 vintage, equity would be wiped out and around 10 to 15 percent underwater, especially with those that originated during the second half of 2005. This next chart is what an equity gap might look like on a 2005 vintage property. Above 1.6 would constitute the 2006, 2007 and 2008 vintages. Those properties are severely underwater and would require large equity infusions to be adequately capitalized.


Turning to the maturity schedule, one can note that so far in 2010 the bankers were mostly dealing with 2004 and pre- 2004 vintages, the majority of which are marginally manageable for kick-down-the-road solutions.
The COR describes (in theory) what is necessary to refinance a balloon under current conditions:
"To qualify for refinancing, under current conditions, the borrower must generally satisfy three criteria: (1) the new loan balance must be greater than or equal to the existing loan balance, (2) the LTV ratio must be no greater than 70 (current maximum LTVs are between 60 and 65), and (3) the DSCR (assuming a 10-year, fixed-rate loan with a 25-year amortization schedule and an 8 percent interest rate) must be no less than 1.3.253. DSCR is Net Operating Income (NOI) / Total Debt Service."
Then there is the issue of neglect and deferred maintenance. Steve Wynn commenting on Las Vegas properties:
- “One of the things that’s happening here as the market softened and many of these companies with very bad capital structures neglected their properties rather severely. And the properties are all showing the wear and tear. They’re showing the lack of capital expenditures. And the public, of course, takes note of this immediately. There’s no secrets. The minute the place is not clean or it’s getting threadbare, it has a very bad effect on your clientele.
There's no doubt that much of the maturing CRE comes up well short on these qualifications, but who is looking.
During the first quarter of this year, lenders restructured loans totaling $23 billion; however, those were the easier 2003 through early 2005 vintages. Recent statistics have shown a drop in the percentage of loans successfully refinanced at maturity to 20.5 percent by balance in the last month, according to Cushman and Wakefield. Three to six months after maturity, the percentage of those refinanced or paid off climbs to 33 percent and 56 percent respectively. For the rest of the ballooning loans, it's much easier to extend and pretend by granting one-year extensions or by doing nothing at all. This is particularly true for smaller banks, which will collapse once the extend-and-pretend tab comes due.
One of the problems with tracking the numbers is the lag in reporting, but the Trepp chart on CMBS indicates where the market stood sometime during the first half of 2010. Roughly 9 percent of the market is dicey, but foreclosures, and especially REOs, are in the first inning. Note that so far only 1.1 percent are matured balloons. Compounding the woes, however, are recent signs that prices are swooning again. A commentary from Costar says CRE prices were swooning in June with distressed sales making up 23 percent.
Source: Trepp

While eyeballing the maturity charts, count forward five years and note that during the first half of 2010 the 2005 vintages were maturing closer to 1.4 on the price index (first of 2005 origination) rather than 1.6 (second half 2005 origination). However, as this year winds down and 2011 arrives, the bankers will be dealing with a tougher strain of late 2005 and 2006 underwater CRE debts. Then, stunned and staggering, the banking system will be hit with a tidal wave and a final knock-out punch of large-scale and severely underwater vintages from 2006 to 2008, which are duly listed on the late 2011 to 2012 maturity schedule. Unless the fundamentals (higher rents, lower vacancies and interest-rate wildcards) are strongly improving, the market will be in an acute condition well before that onslaught.


Although it appears that small banks have the greatest exposure relative to their size, large banks have engaged heavily in derivative and credit default swaps activities, including as guarantors, and at levels far in excess of loan exposure. Is this just more AIG and Enron-style black box gaming?

The next two charts from bankregdata.com provide first quarter 2010 bank data. The first chart shows CRE and the second construction and development (C&D). This excellent source publishes a second quarter report on August 25.
Moodys says, "A large number of smaller banks, which constitute just 15 percent of total system assets but carry 50 percent of all CRE loans outstanding, will likely continue to struggle under the weight of their CRE exposures, and many will collapse."


Bankregdata.com's next charts from the first quarter of 2010 show the CRE non-performing and charge-off rate for the entire banking system. It also clearly indicates the completely delusional commitment of the regulators to the extend-and-pretend strategy. Little has been charged off.
Commercial Real Estate lending:

C&D

While this waiting and praying transpires, severities or recoveries on liquidations are worsening, up to the tune of 50 percent.
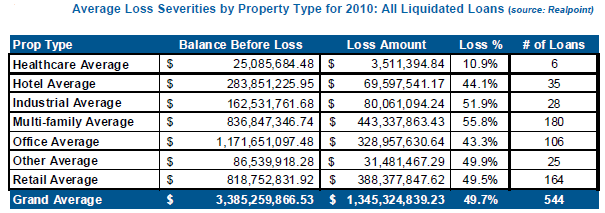
I would highly recommend readers scan pages 111-112 in the COR, where both Geithner and the Federal Reserve are rebuked for their opaqueness in the February 2009 stress test report. Regardless of the unknown methodology used, the result of the stress test would have us believe that the total CRE debt against the underlying collateral of about $3.4 trillion means suffering losses of about 10 percent under the adverse scenario. More importantly, the exposure of the system beyond the largest 19 banks was not analyzed at all in the stress test. In addition, the focus of the test was only through the end of 2010. They conveniently overlooked the financing structure of almost all CRE beyond that point.

Disclosure: no positions