The chart below is an illustration of the weekly share price change indices for the Eqcome CEF Portfolios™: CEFBig10™, CEFMuni10™ and CEFDisc10™ relative to the indexed S&P 500 (thin “green” line) at the time of their respective inceptions through the week ending November 12th ‘10.
Eqcome CEF Portfolios™: The CEFBig10™ is a portfolio of 10 leading CEFs in 10 of the major CEF fund types (objective: diversified total return); the CEFMuni10™ is composed of 10 of the largest national muni CEF funds (objective: tax-exempt income); the CEFDisc10™ is a portfolio of 10 CEFs that have been chosen based on an investment algorithm of changing relative premium discount spreads (objective: capital appreciation). (See website[1] for further information regarding the portfolios.
Observations: The chart below does not reflect the incremental return from annualized distributions for the 3 CEF portfolios which averaged 6.4% versus 1.9% for the SPDR S&P 500 ETF (SPY). So, there is an incremental return of 4.5% due to the average CEFs distributions that is not being reflected in the chart below. 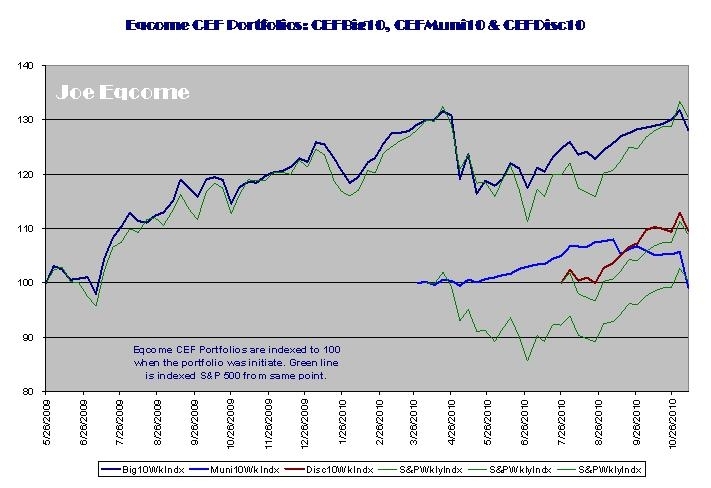
The CEFBig10 and CEFDisc10 has generally tracked the market—excluding distributions. The CEFMuni10, which had significantly outperformed the S&P 500, has recently suffered a reversal of its appreciation. This is due to a perfect storm of high valuations, leverage and investor concerns over the financial distress of municipal finances which came together to place downward pressure on the muni CEF share prices.
Caveats: Eqcome CEF Portfolios™ have limited investment history and their respective performance may not be an indication of their future performance.
The actual performances of the three portfolios are from their respective inceptions as opposed to a theoretical “look back” of stocks in the portfolios, as such “back testing” can be “gamed”. What you see is what you get. While I wish the track records were longer, it “is what it is”.
This information is being presented for informational purposes only.
Joe Eqcome
[1] joeeqcome.web.officelive.com/default.aspx