Apple (AAPL) announces earnings next week, and so we feel it is an appropriate time to quantitatively value the equity.
Justification for a Weighted Averages Model
To value this stock, we have employed a FCFE Weighted Averages Model (further explained below). We believe this model is an appropriate valuation method for all equities. In relation to Apple, we feel it is especially useful since Apple's growth can be qualitatively segmented: excellent short-term growth in the upcoming year due to iPhone 6 and Mac sales; good growth in the next 5 years due to brand relevancy and superior technology/products; and stable growth thereafter due to continued innovation.
We affirm that the iPhone 6 will continue to post record-breaking numbers, and that Mac sales will continue their upward trend. We also credit the iWatch as having good growth potential for the company, as can be detailed here. We then affirm that Apple's growth over the next five years should be good, maybe even double-digit good, although we still think Apple could experience negative earnings growth (as they did from 2013 to 2012) if the iPad continues to slump, the iWatch doesn't take off, and Mac and iPhone sales stagnate.
Further, we believe in the longevity of Apple. Apple has sustained itself as a dominant player in the tech realm for over a decade now, and we don't see that trend reversing in the long-run. Despite concerns over R&D spending, we believe those concerns, at worst, evince themselves in stagnated long-term growth (i.e. a stable growth rate of 0%).
Our Five-Year Forecasts (An Income Statement Look)
We have crafted two five-year forecasts (optimistic and pessimistic) for Apple for determining what growth rate bounds we should employ in our Weighted Averages Model.
To understand the parameters that influence these forecasts, let us examine segmented revenues for Apple, starting with the iPhone. We have applied an R^2 Analysis to forecast future growth rates. Accordingly, we have fit two best-fit lines (one linear and one logarithmic) to iPhone revenues since 2007.
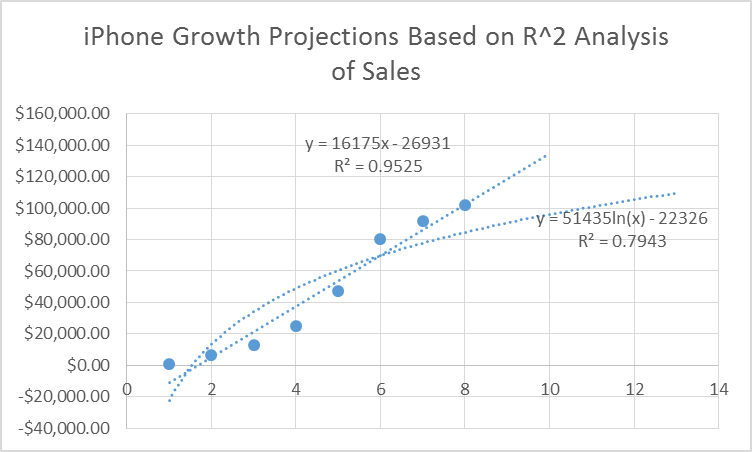
For our model, we have forecasted revenues out five years. The data table corresponding to this analysis then is as follows (where italics represent forecasted data and average data at bottom represents five year average of years 2015-2019):
| iPhone Growth Projections Based on R^2 Analysis of Sales | |||||
| Year | Model | Sales ( $M) - Log | Growth | Sales ($M) -Lin | Growth |
| 2007 | iPhone | $630.00 | 100.00% | $630.00 | 100.00% |
| 2008 | iPhone 3G | $6,742.00 | 970.16% | $6,742.00 | 970.16% |
| 2009 | iPhone 3GS | $13,033.00 | 93.31% | $13,033.00 | 93.31% |
| 2010 | iPhone 4 | $25,179.00 | 93.19% | $25,179.00 | 93.19% |
| 2011 | iPhone 4S | $47,057.00 | 86.89% | $47,057.00 | 86.89% |
| 2012 | iPhone 5 | $80,477.00 | 71.02% | $80,477.00 | 71.02% |
| 2013 | iPhone 5C/S | $91,729.00 | 13.98% | $91,729.00 | 13.98% |
| 2014 | iPhone 6/Plus | $101,991.00 | 11.19% | $101,991.00 | 11.19% |
| 2015 | iPhone 6S | $90,688.25 | -11.08% | $118,644.00 | 16.33% |
| 2016 | iPhone 7 | $96,107.46 | 5.98% | $134,819.00 | 13.63% |
| 2017 | iPhone 7S | $101,009.74 | 5.10% | $150,994.00 | 12.00% |
| 2018 | iPhone 8 | $105,485.17 | 4.43% | $167,169.00 | 10.71% |
| 2019 | iPhone 8S | $109,602.17 | 3.90% | $183,344.00 | 9.68% |
| Average: | 1.67% | Average: | 12.47% | ||
We performed a similar analysis on iPhone growth rates, though with only one best fit line (since all other best fit lines sported inefficient R^2 values).
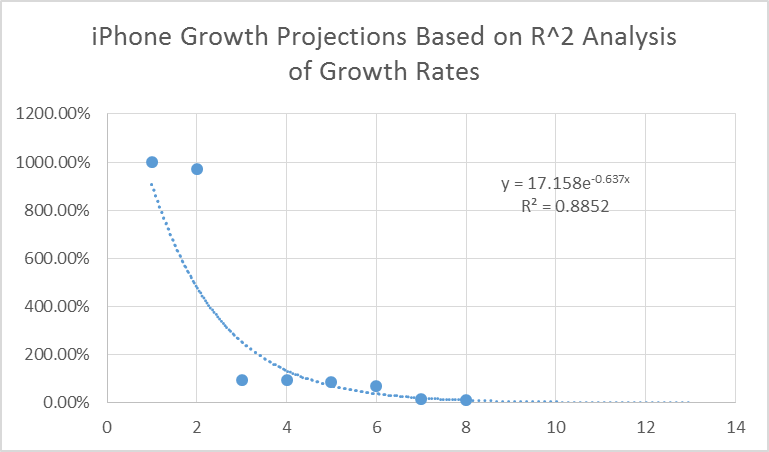
The data table for forecasted growth rates is as follows:
| iPhone Growth Projections Based on R^2 Analysis of Growth Rates | |||
| Year | Model | Sales ($M) | Growth - Exp |
| 2007 | iPhone | $630.00 | 100.00% |
| 2008 | iPhone 3G | $6,742.00 | 970.16% |
| 2009 | iPhone 3GS | $13,033.00 | 93.31% |
| 2010 | iPhone 4 | $25,179.00 | 93.19% |
| 2011 | iPhone 4S | $47,057.00 | 86.89% |
| 2012 | iPhone 5 | $80,477.00 | 71.02% |
| 2013 | iPhone 5C/S | $91,729.00 | 13.98% |
| 2014 | iPhone 6/Plus | $101,991.00 | 11.19% |
| 2015 | iPhone 6S | $107,795.58 | 5.69% |
| 2016 | iPhone 7 | $111,040.20 | 3.01% |
| 2017 | iPhone 7S | $112,807.85 | 1.59% |
| 2018 | iPhone 8 | $113,757.61 | 0.84% |
| 2019 | iPhone 8S | $114,264.14 | 0.45% |
| Average: | 2.32% | ||
From our analysis then, we draw two conclusions: iPhone growth rates over the next five years could be as high as 12.47% or as low as 1.67%. For our five year forecasts, then, we take 12.47% as iPhone sales' growth rate in the optimistic scenario, and 1.67% as iPhone sales' growth rate in the pessimistic scenario.
We performed a similar analysis iPad and Mac sales.
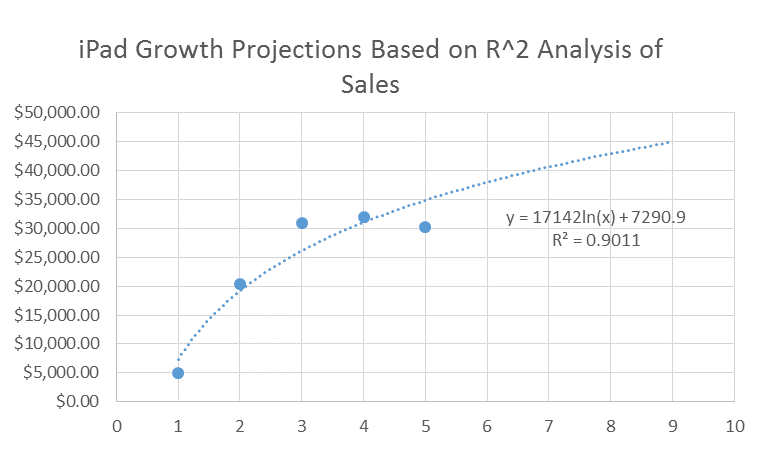
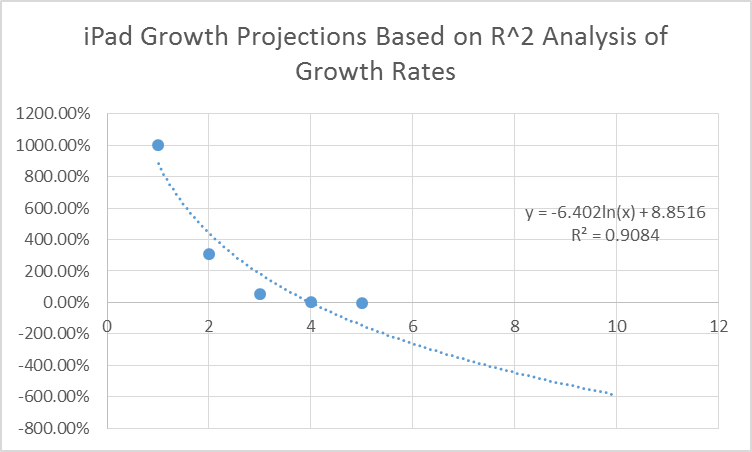
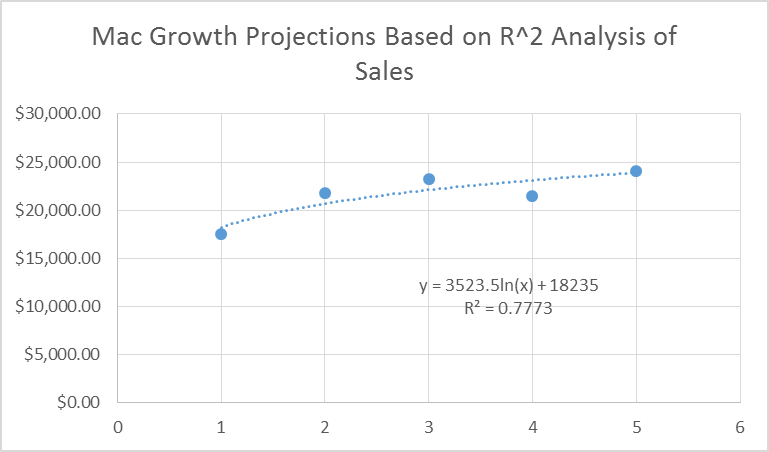
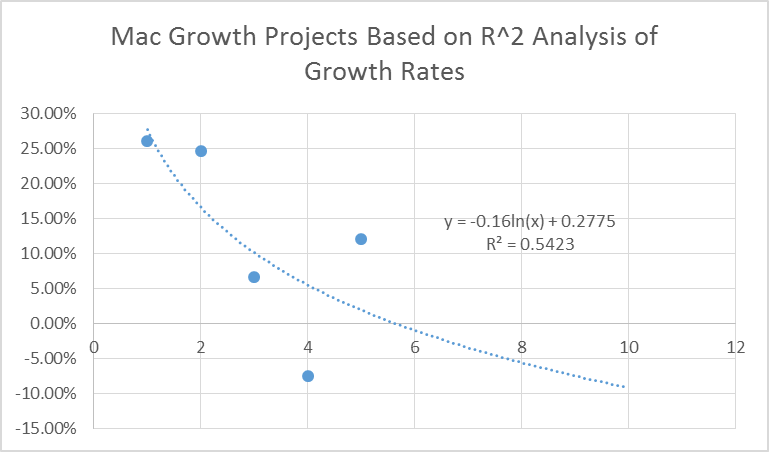
Our data tables yield the following inputs for our forecasts:
- 5.84% growth rate for iPad sales in Optimistic Forecast
- 2.00% growth rate for Mac sales in Optimistic Forecast
- -15.00% growth rate for iPad sales in Pessimistic Forecast (representation of iPad sales trending towards 0 in long-run)
- -5.26% growth rate for Mac sales in Pessimistic Forecast
In our optimistic scenario, we further assume that the iWatch can net $17 billion in sales by the end of 2015, a figure derived by Morgan Stanley's Katy Hubert. Her argument is that Apple's newer innovations tend to outsell prior innovations in their first 12 months. We believe this argument makes sense, and thus affirm that a figure of $17 billion is an optimistic target for iWatch sales (outselling both the iPhone and iPad in its first 12 months).
In our pessimistic scenario, we assume that this figure performs less well than prior Apple innovations, and thus slice Hubert's $17 billion sales target in fourth.
In our optimistic scenario, we believe iTunes and Software sales and Accessories sales should maintain constant positive growth, where as in our pessimistic scenario, we assume constant negative growth.
The last major difference between the two scenarios will be found in the Future Innovations row. In our optimistic scenario, we assume Apple will have some new, big innovation in the next five years that, per Hubert's argument, will outsell the iWatch in its first 12 months. In our pessimistic scenario, we assume Apple will not have any big innovations in the next five years.
Apple Optimistic Scenario | ||||||
Key Assumptions: | ||||||
Ramped Up iPhone Sales | Successful Innovation in Next Five Years | |||||
iPad regains traction | Mac Sales Increase | |||||
Successful iWatch Launch | ||||||
Product | 2014 | 2015 | 2016 | 2017 | 2018 | 2019 |
iPhone | $101,991 | $114,739.88 | $129,082.36 | $145,217.65 | $163,369.86 | $183,791.09 |
% Change | 11.19% | 12.50% | 12.50% | 12.50% | 12.50% | 12.50% |
iPad | $30,283 | $32,051.53 | $33,923.34 | $35,904.46 | $38,001.28 | $40,220.55 |
% Change | -5.31% | 5.84% | 5.84% | 5.84% | 5.84% | 5.84% |
Mac | $24,079 | $24,560.58 | $25,051.79 | $25,552.83 | $26,063.88 | $26,585.16 |
% Change | 12.08% | 2.00% | 2.00% | 2.00% | 2.00% | 2.00% |
iPod | $2,286 | $1,143.00 | $571.50 | $285.75 | $142.88 | $71.44 |
% Change | -48.18% | -50.00% | -50.00% | -50.00% | -50.00% | -50.00% |
iWatch | $0 | $17,000 | $17,850 | $18,743 | $19,680 | $20,664 |
% Change | 0.00% | 100.00% | 5.00% | 5.00% | 5.00% | 5.00% |
New Innovations | $0 | $0 | $0 | $0 | $0 | $18,000 |
% Change | 0.00% | 0.00% | 0.00% | 0.00% | 0.00% | 100.00% |
iTunes/Software | $18,063 | $20,230.56 | $22,658.23 | $25,377.21 | $28,422.48 | $31,833.18 |
% Change | 12.54% | 12.00% | 12.00% | 12.00% | 12.00% | 12.00% |
Accessories | $6,093 | $6,519.51 | $6,975.88 | $7,464.19 | $7,986.68 | $8,545.75 |
% Change | 6.78% | 7.00% | 7.00% | 7.00% | 7.00% | 7.00% |
Net Sales | $182,795 | $216,246 | $236,113 | $258,544 | $283,667 | $329,712 |
% Change | 6.95% | 18.30% | 9.19% | 9.50% | 9.72% | 16.23% |
Apple Pessimistic Scenario | ||||||
Key Assumptions: | ||||||
iPhone loses market share to Android | iWatch unsuccessful launch | |||||
Windows 10 hurts Mac Sales | No new innovations in 5 years | |||||
iPad doesn't regain traction | ||||||
Product | 2014 | 2015 | 2016 | 2017 | 2018 | 2019 |
iPhone | $101,991 | $103,694.25 | $105,425.94 | $107,186.56 | $108,976.57 | $110,796.48 |
% Change | 11.19% | 1.67% | 1.67% | 1.67% | 1.67% | 1.67% |
iPad | $30,283 | $25,740.55 | $21,879.47 | $18,597.55 | $15,807.92 | $13,436.73 |
% Change | -5.31% | -15.00% | -15.00% | -15.00% | -15.00% | -15.00% |
Mac | $24,079 | $22,812.44 | $21,612.51 | $20,475.69 | $19,398.67 | $18,378.30 |
% Change | 12.08% | -5.26% | -5.26% | -5.26% | -5.26% | -5.26% |
iPod | $2,286 | $1,143.00 | $571.50 | $285.75 | $142.88 | $71.44 |
% Change | -48.18% | -50.00% | -50.00% | -50.00% | -50.00% | -50.00% |
iWatch | $0 | $4,250 | $4,335 | $4,118 | $3,912 | $3,717 |
% Change | 0.00% | 100.00% | 2.00% | -5.00% | -5.00% | -5.00% |
New Innovations | $0 | $0 | $0 | $0 | $0 | $0 |
% Change | 0.00% | 0.00% | 0.00% | 0.00% | 0.00% | 0.00% |
iTunes/Software | $18,063 | $17,701.74 | $16,993.67 | $15,974.05 | $14,696.13 | $13,226.51 |
% Change | 12.54% | -2.00% | -4.00% | -6.00% | -8.00% | -10.00% |
Accessories | $6,093 | $5,971.14 | $5,851.72 | $5,734.68 | $5,619.99 | $5,507.59 |
% Change | 6.78% | -2.00% | -2.00% | -2.00% | -2.00% | -2.00% |
Net Sales | $182,795 | $181,313 | $176,669 | $172,372 | $168,554 | $165,133 |
% Change | 6.95% | -0.81% | -2.56% | -2.43% | -2.22% | -2.03% |
We then assume operating margins remain constant in the next five years due to the maturity of Apple as a business.
Apple High-Side Earnings | ||||||
2014 | 2015 | 2016 | 2017 | 2018 | 2019 | |
Revenue | $182,795 | $216,246 | $236,113 | $258,544 | $283,667 | $329,712 |
Net Income | $39,510 | $46,731 | $51,024 | $55,871 | $61,300 | $71,251 |
Net Margin | 21.61% | 21.61% | 21.61% | 21.61% | 21.61% | 21.61% |
% Change | 6.68% | 18.28% | 9.19% | 9.50% | 9.72% | 16.23% |
AVERAGE CHANGE (2015-19): | 12.58% | |||||
Apple Low-Side Earnings | ||||||
2014 | 2015 | 2016 | 2017 | 2018 | 2019 | |
Revenue | $182,795 | $181,313 | $176,669 | $172,372 | $168,554 | $165,133 |
Net Income | $39,510 | $39,182 | $38,178 | $37,250 | $36,424 | $35,685 |
Net Margin | 21.61% | 21.61% | 21.61% | 21.61% | 21.61% | 21.61% |
% Change | 6.68% | -0.83% | -2.56% | -2.43% | -2.22% | -2.03% |
AVERAGE CHANGE (2015-19): | -2.01% | |||||
We can then see that our five year forecasts an earnings growth rate between roughly -3% and 12%. These growth rate bounds will lay the foundation for our valuation model.
The Model
As stated before, we have employed a FCFE Weighted Averages Model to value AAPL. We employed a similar model for GoPro (GPRO) and Michael Kors (KORS), which you can find here and here.
The model is structured around 112 price targets which are calculated from linear combinations of 16 equidistant, short-term growth rates varying between -3% and 12% and 7 equidistant, long-term growth rates varying between 0% and 6% in a two-stage (high-growth and stable-growth) FCFE model.
We then segregate the price targets based on common stable-growth rates, and calculate a weighted average for each of the 7 stable growth-rates, based on our inputted weights. In this model, our inputted weights are derived from an assumed Gaussian distribution of probabilities of short-term growth rates with mean 4.5% and variance of 22.67. In other words, we assume that the probability of growth rates are normally distributed between -3% and 12%, with the most likely rate being 4.5% (think a bell curve).
We then calculate the value of the probability density function for each value, find its absolute difference from the norm (50%), and do 1 divided by that figure to arrive at our weights.
| Gaussian Distribution Amongst Short-Term Growth Rates | ||||
| Growth Rate (in %) | Squared Difference | PDF Value | Difference from Mean | Weights |
| 12.00 | 56.25 | 2.42% | 47.58% | 2.101852586 |
| 11.00 | 42.25 | 3.30% | 46.70% | 2.141308889 |
| 10.00 | 30.25 | 4.30% | 45.70% | 2.18816106 |
| 9.00 | 20.25 | 5.36% | 44.64% | 2.240178014 |
| 8.00 | 12.25 | 6.40% | 43.60% | 2.293330768 |
| 7.00 | 6.25 | 7.30% | 42.70% | 2.341937171 |
| 6.00 | 2.25 | 7.97% | 42.03% | 2.379463723 |
| 5.00 | 0.25 | 8.33% | 41.67% | 2.400002737 |
| 4.00 | 0.25 | 8.33% | 41.67% | 2.400002737 |
| 3.00 | 2.25 | 7.97% | 42.03% | 2.379463723 |
| 2.00 | 6.25 | 7.30% | 42.70% | 2.341937171 |
| 1.00 | 12.25 | 6.40% | 43.60% | 2.293330768 |
| 0.00 | 20.25 | 5.36% | 44.64% | 2.240178014 |
| -1.00 | 30.25 | 4.30% | 45.70% | 2.18816106 |
| -2.00 | 42.25 | 3.30% | 46.70% | 2.141308889 |
| -3.00 | 56.25 | 2.42% | 47.58% | 2.101852586 |
| Mean: | 4.50 | |||
| Variance: | 22.66666667 | |||
| Standard Deviation: | 4.760952286 |
Using these weights, we can then calculate our weighted averages for common stable-growth rates. For example, consider our weighted average table for 6% stable growth rate.
| 6% Stable Growth Rate | |||
| Rate | Weight | PT | Weighted PT |
| 12.00% | 2.101852586 | $234.78 | $493.47 |
| 11.00% | 2.141308889 | $223.93 | $479.50 |
| 10.00% | 2.18816106 | $213.46 | $467.08 |
| 9.00% | 2.240178014 | $203.35 | $455.54 |
| 8.00% | 2.293330768 | $193.60 | $443.99 |
| 7.00% | 2.341937171 | $184.19 | $431.36 |
| 6.00% | 2.379463723 | $175.12 | $416.69 |
| 5.00% | 2.400002737 | $166.37 | $399.29 |
| 4.00% | 2.400002737 | $157.94 | $379.06 |
| 3.00% | 2.379463723 | $149.82 | $356.49 |
| 2.00% | 2.341937171 | $141.99 | $332.53 |
| 1.00% | 2.293330768 | $134.46 | $308.36 |
| 0.00% | 2.240178014 | $127.21 | $284.97 |
| -1.00% | 2.18816106 | $120.24 | $263.10 |
| -2.00% | 2.141308889 | $113.53 | $243.10 |
| -3.00% | 2.101852586 | $107.08 | $225.07 |
| Weighted Average: | $165.31 | ||
So, this tell us that the present value for Apple with a fixed stable-growth rate of 6% is $165.31. We perform this same analysis for 5%, 4%, 3%, 2%, 1%, and 0% stable growth rates, and then calculate another weighted averages based on this data.
Again, though, we must calculate our weights. We assume Gaussian distribution of probabilities of long-term growth rates with mean 3% and variance 4.67. In other words, we assume that the probability of growth rates are normally distributed between 0% and 6%, with the most likely rate being 3%.
| Gaussian Distribution Amongst Stable Growth Rates | ||||
| Growth Rate (in %) | Squared Difference | Gaussian Height | Difference from Mean | Weights |
| 6.00 | 36 | 7.04% | 42.96% | 2.327790706 |
| 5.00 | 25 | 12.03% | 37.97% | 2.633686667 |
| 4.00 | 16 | 16.59% | 33.41% | 2.993214187 |
| 3.00 | 9 | 18.47% | 31.53% | 3.171325041 |
| 2.00 | 4 | 16.59% | 33.41% | 2.993214187 |
| 1.00 | 1 | 12.03% | 37.97% | 2.633686667 |
| 0.00 | 0 | 7.04% | 42.96% | 2.327790706 |
| Mean: | 3.00 | |||
| Variance: | 4.666666667 | |||
| Standard Deviation: | 2.160246899 |
We can now calculate our overall weighted average by applying these Gaussian-derived weights.
| Rate | Weight | PT | Weighted PT |
| 6% | 2.327790706 | $165.31 | $384.80 |
| 5% | 2.633686667 | $129.92 | $342.18 |
| 4% | 2.993214187 | $108.31 | $324.19 |
| 3% | 3.171325041 | $93.73 | $297.25 |
| 2% | 2.993214187 | $83.24 | $249.16 |
| 1% | 2.633686667 | $75.32 | $198.38 |
| 0% | 2.327790706 | $69.14 | $160.95 |
| Weighted Average: | $102.56 |
We thus arrive at a present value of roughly $103 per share for AAPL. We assume a 15% uncertainty affiliated with this present value given variable market conditions in the tech industry, and thus have a present value price range of $87 to $118.
Mathematically, this means we would long the stock under $87 (perhaps lower to ensure higher profit return) and short the stock above $118 (perhaps higher to ensure higher profit return).
Injecting qualitative knowledge, however, we aren't convinced of shorting the stock at any price near its current market value, considering the percent of shares outstanding short is 1.05%.
Justification for Parameters
Our FCFE Weighted Averages Model is parameter sensitive around growth-rates and the weights we apply to those growth rates; discount rates and the Beta values that affect them; and changes in operating margins.
We believe the high-side rate accurately reflects continued growth in iPhone sales and Mac sales, a successful iWatch product launch, a revamped iPad product line and sustained iPad revenue growth, and successful future innovations.
We believe the low-side rate accurately reflects stagnated growth in iPhone sales and Mac sales, an unsuccessful iWatch product launch, iPad sales continuing to decline, and less-than-par future innovations.
We also think that any growth rate in-between these high-side and low-side targets is plausible. We applied a Gaussian-derived weight to these growth rates because we believe the high-side scenario and the low-side scenario are equally as unlikely, and thus that probabilities should increase as the growth-rates converge to the mean.
We also believe a 4.5% mean short-term growth rate is appropriate.
In all our 112 simulations, we held constant Beta values. Our rationale is simply that during a high-growth phase or simply during a phase inherently infused with volatility (such as the phase we believe Apple is heading into), we do not believe the volatility of the stock in relation to the market will change drastically enough (based on growth rates) to affect the present value.
As such, we have two constant Beta values across all 112 simulations: 1.25 for short-term, and 1 for long-term. We believe the short-term Beta should be greater than the long-term Beta, and that the short-term Beta should be greater than 1, representing greater volatility than the market (which, with iWatch launch, iPad's current ambiguous state, and the iPhone booming, is what Apple will surely be experiencing going forward).
Refer to the chart below to see that as profit margin and revenue have steadied out, Apple's Beta has fallen below 1, which makes sense.
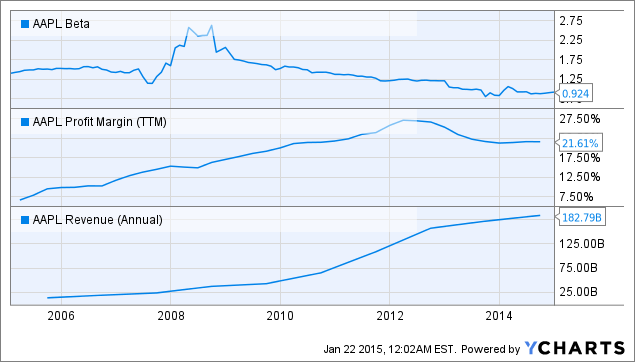
We do believe, though, that Apple is entering a phase of more volatility than the prior year, and thus place a higher Beta value of 1.25, fairly in-line with the Beta value the stock sported during the previous iPhone launch.
Further, we believe that a long-term Beta of 1 is appropriate, as it ensures a return to market rate returns, something that is very well expected of a mega-tech company like Apple.
As we also hold the risk-free rate and market rate relatively constant (per current data and analyst estimates), our discount rates throughout the 112 simulations are constant. We have a short-term discount rate marginally higher than the long-term discount rate, which is what we expect.
As Apple has become a matured company with much of its high-high-growth behind it, we believe operating margins should be held relatively constant going forward. Refer to the chart below, where we can see operating margins have stagnated in the past 2-3 years.
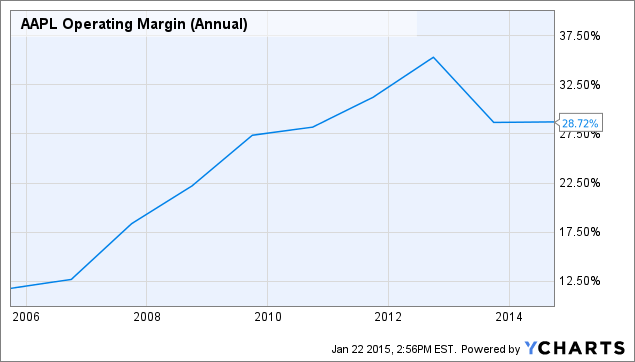
AAPL Operating Margin (Annual) data by YCharts
Conclusion
We feel our model appropriately accounts for various plausible growth scenarios for AAPL, and weights them appropriately using Gaussian-derived weights. We further believe that while our valuation is quantitatively-driven, it possesses qualitatively-driven inputs that reflect our sentiment concerning the company and its upside.
As such, we believe Apple is not positioned for tremendous growth going forward. There is, though, undoubtedly potential for tremendous growth. Assuming 12% short-term growth and 6% long-term growth, we arrive at a present value of just over $234 per share (see 6% stable growth chart above), or more than double current market value. Further, we also believe Apple will beat on earnings next week, which will drive market value up in the short-run.
Considering our weighted averages model, though, values the stock at less than current market value, we do affirm a neutral stance on Apple.