Overview
The 10-20-30 averages strategy, developed by Dr. Samir Elias, and practiced by Teddi Knight, is a great method for find Put Selling options candidates. Being a lead indicator, the strategy is a great tool for finding stocks which may have hit a technical bottom, which are often ready for a reversal.
I personally have found this indicator easy to use, and combine it with RSI, Chaikin Money Flow [CMF], MACD, and Volume as a simple and easy to use system.
Note: As a conservative investor, I throw out the "20 EMA", part of the strategy, as that to me is more of a "get ready but don't do anything yet" indicator. I wait until the 10SMA actually does cross below the 30EMA before getting ready to take actions.
Thinkorswim has a powerful Scan system for finding a list of candidates.
Using the Tool
1. Login to the thinkorswim desktop application and click the "Scan" tab

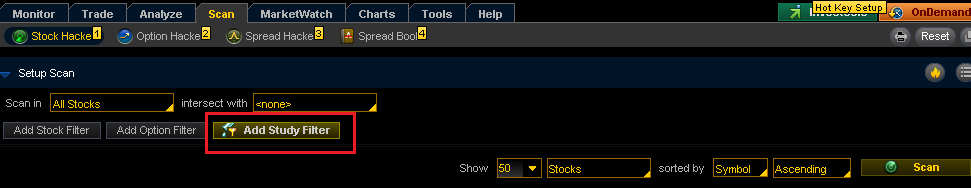
2. On the right side, click the X buttons to remove all the existing Filters.

3. Click the "Add Study Filter" button
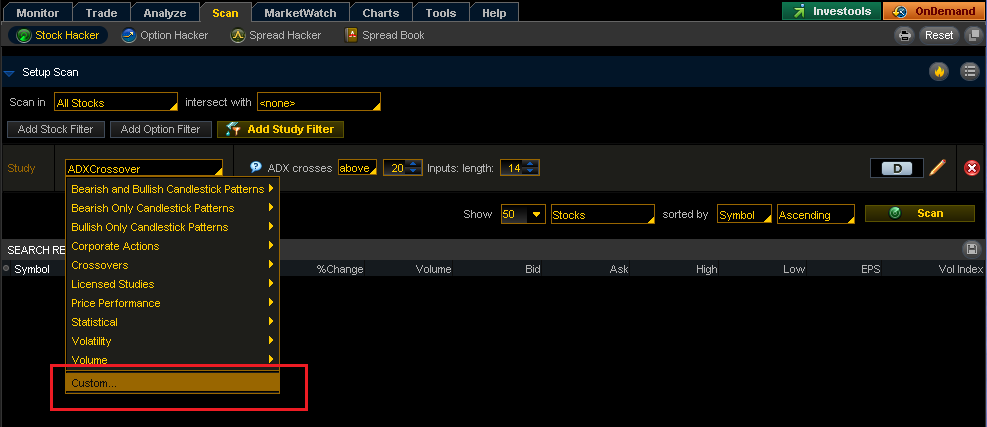
4. In the "Study" drop down box, select "Custom…"
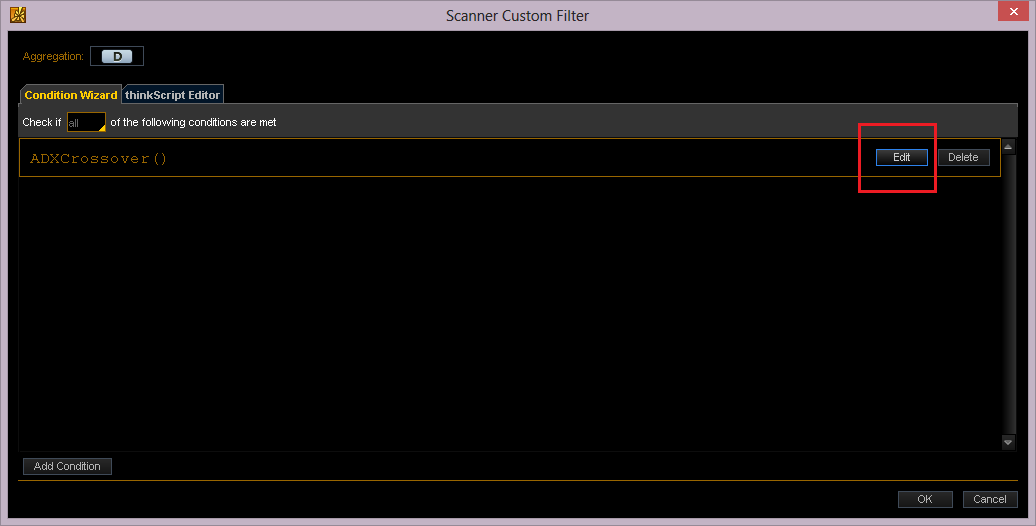
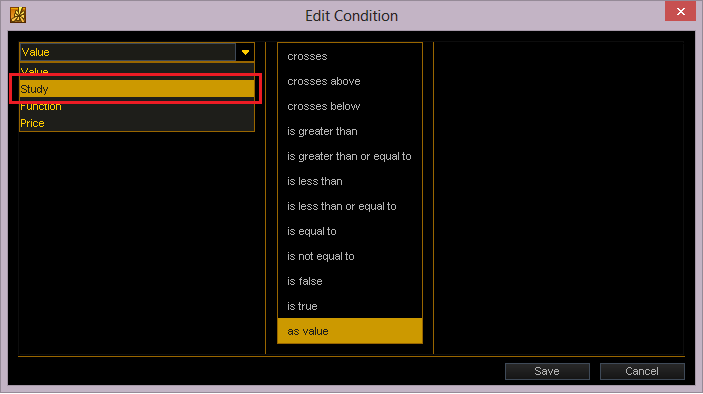
5. Click the "Edit" button
6. Select "Study" in the drop down box
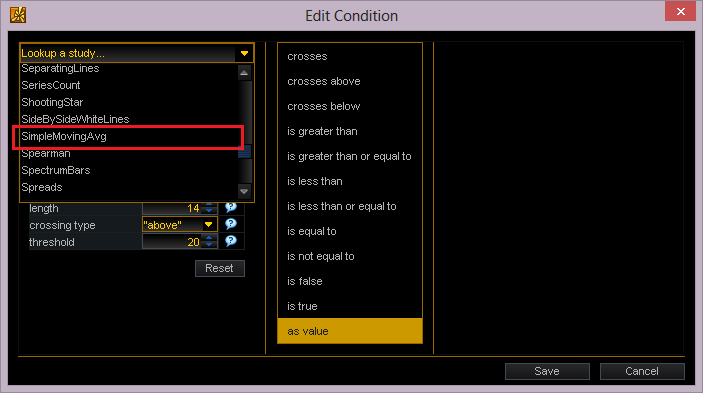
7. Choose "SimpleMovingAvg" in the "Lookup a study…" drop down box.
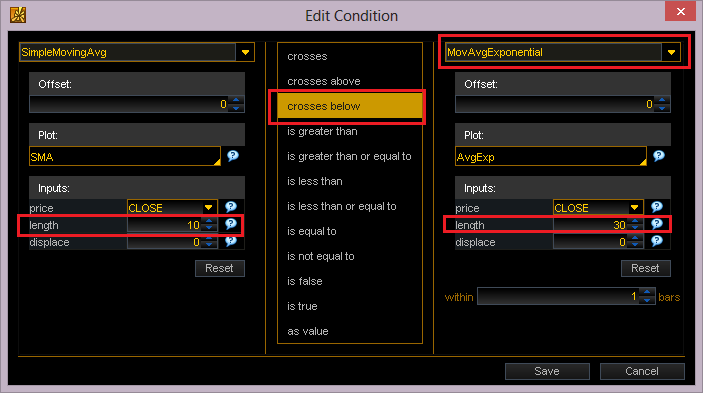
8. Now choose the following values in the Edit Condition box:
Left column - under "Inputs", "length" should be 10
Middle column - set to "crosses below"
Right column -- drop down box, choose "Study", then Choose "MovAvgExponential"
Right column - under "Inputs", "length" should be 30
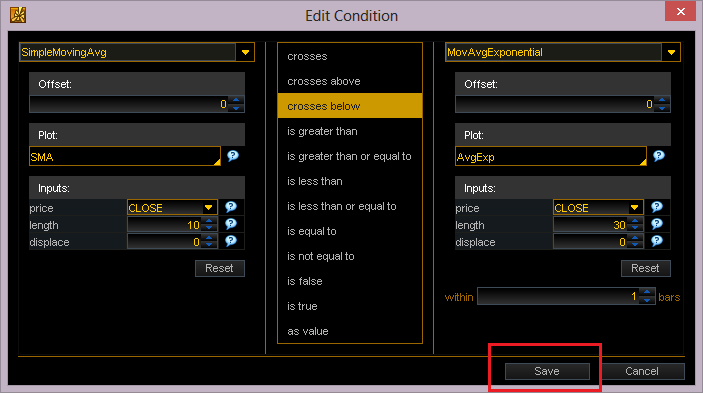
9. Click Save
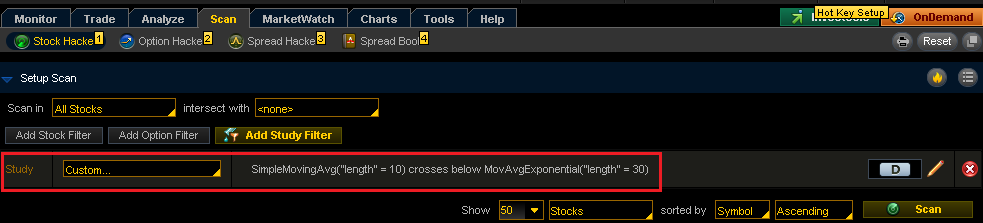
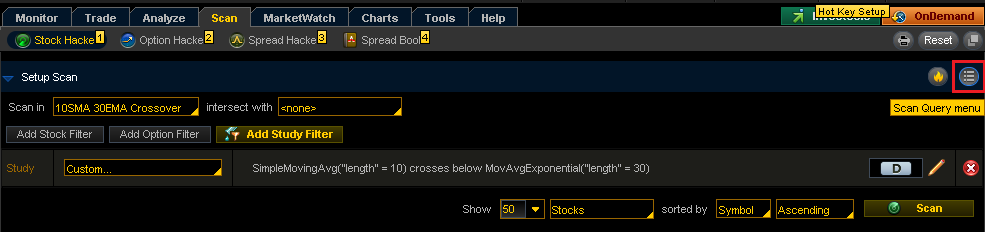
10. Your screen should now look like the following rule. Go ahead and click OK to save the filter.

11. Notice the Study you just created is now a part of your Scan
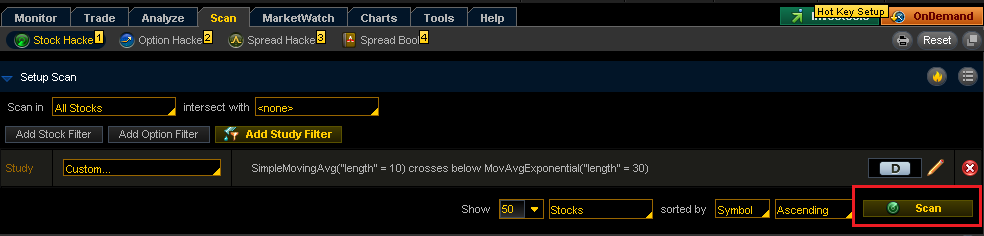
12. Now click the Scan button to populate your list!
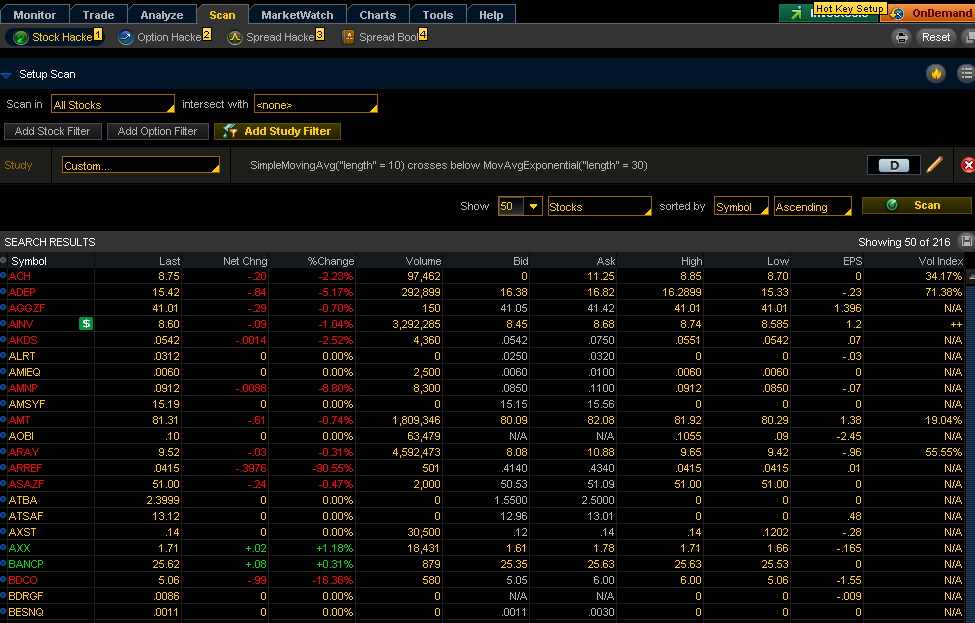
13. The Search Results will now present all known stocks that meet your filter condition.
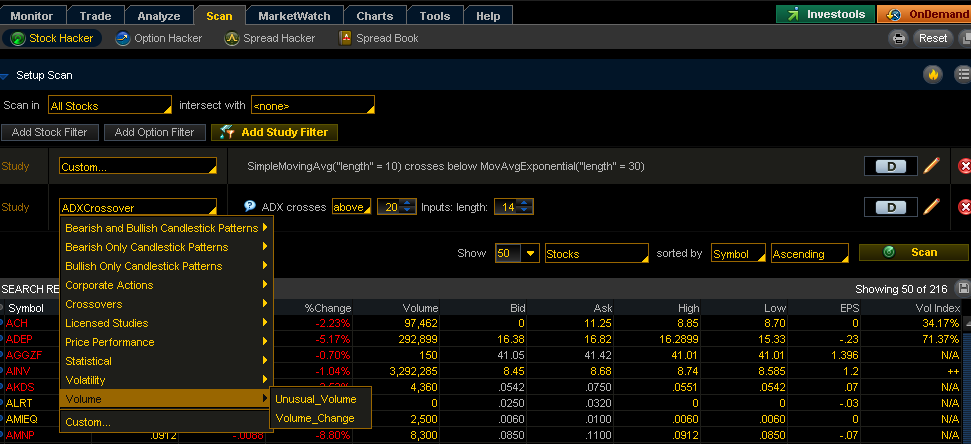
14. You can add additional Filters as well to your Scan, such as Volume indicators, or Corporate Actions like Earnings or Dividends.
NOTE: If you would like to add a study you don't see on the initial menu (like RSI), check the "Custom…" menu at the bottom for more choices.

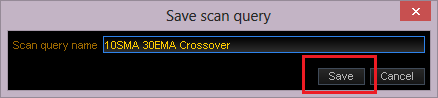
15. Make sure to save your Scan so you can use it later without having to redo all the steps above. Go to the Scan Query Menu and "Save scan query".

16. Later, you can load the Scan query from the same menu. Chose "Load scan query", "Personal", and then find your Previous Scan.


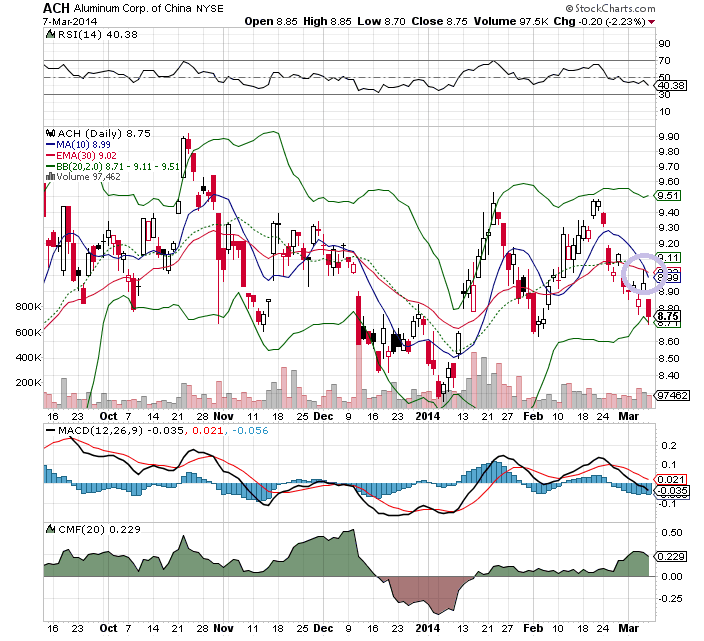
17. Finally, as a way to "audit" our results, I used the actual technical chart from Stockcharts.com, and sure enough, as indicated by the purple highlighted area on the right hand side of the graph, you can see where the 10SMA has indeed crossed the 30EMA.