Japan - Abenomics 3 is only a matter of time
All eyes on Europe this week with the GREXIT bluffing drama reaching a climax. More generally, Europe has been in the limelight since the beginning of the year: GREXIT, ECB Bond purchases, war in Ukraine, SNB's surprise announcement. Today, we escape this mediatic buzz as we try to look 'next to the box', namely to Japan and Abenomics (or what was last year's hot topic). We believe this story could come back into the limelight over the next few months.
All stories are interrelated anyway. In our competitive global world, QE in Europe will certainly trigger more QE in Japan (and perhaps even QE4 in the US) as each country attempts to shift its deflation problems abroad. BOJ did hold off this week on announcing new stimulus. It did however pledge to maintain its current U$700 billion a year monetary expansion. It also reiterated its commitment to increase the asset buying program if necessary in the future. We believe, it was just too early following the introduction of the program in October. Yet, with their 2% inflation target still widely out of reach, we believe it's just a matter of time.
Let's first turn to EUR/JPY as it best reflects why competitive devaluation is at play.
EUR/JPY - Investor's View (a combination of a Weekly, Daily and Hourly chart)
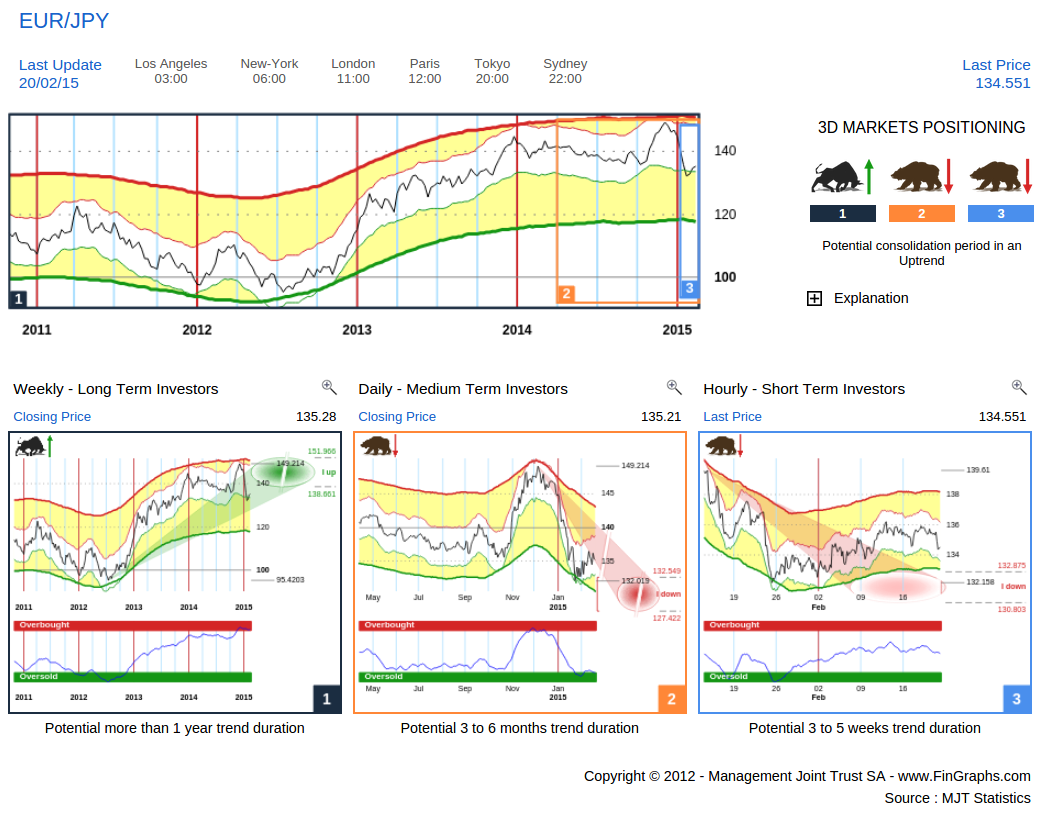
Since December and the anticipation of the ECB Bond buying program, EUR/JPY has entered into a sharp consolidation ("Potential consolidation in an Uptrend"). The longer term Weekly (left hand chart) is still holding on to its uptrend and shows more potential over the next few Quarters. Both the Daily (middle chart) and the Hourly (right hand chart) are however still pointing lower with more downside potential over the next few weeks. Yet, the Daily is in the early stages of an Oversold situation. Hence, even if we do not believe the consolidation is over yet, it is certainly a chart to revisit in a month or so.
On the macro side however, this charts reflects the battle for competitiveness between Japanese and European exporters (Germans exporters especially). Intentions behind both QE programs are similar:
- Force private capital to reallocate from low yielding government securities into productive assets (thereby increasing capital investment) and consumption (a longer shot)
- At the same time, debase the currency to boost competitiveness internationally, which should result in new business projects and create new investment opportunities
In Japan's specific case, the BOJ's stated goal is to lead private and institutional investors to massively reallocate their capital to the domestic equity market as well as diversify holdings through investments abroad in order to generate higher returns. Remember, Japan's demographics are rapidly deteriorating. The country needs to rely on foreign consumption to boost industrial output and on higher yielding investments aboard to cover unfunded liabilities.
Moving on to USD/JPY, and considering our EUR/JPY analysis above and our recent contributions highlighting more downside potential on EUR/USD, we are expecting further Yen deprecation vs USD.
USD/JPY - Investor's View
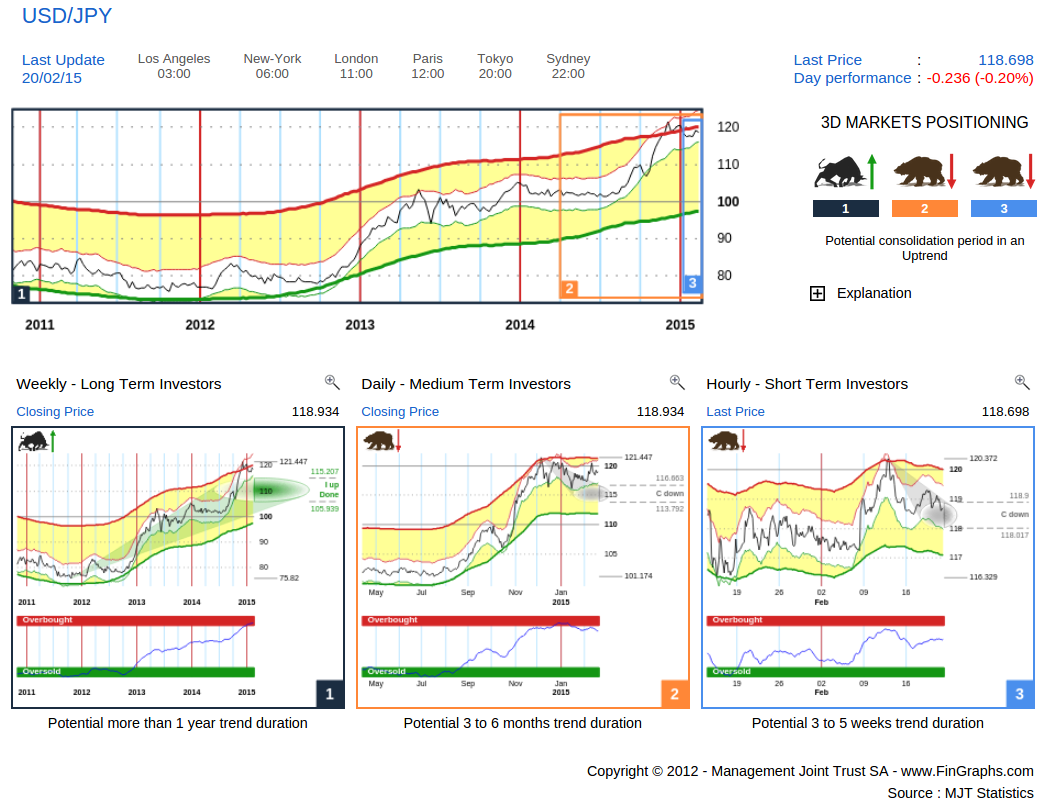
Both the Daily (middle chart) and the Hourly (right hand chart) are consolidating for now. The Daily consolidation has been quite shallow and we would expect it to resume its uptrend over the next few weeks. The Weekly (left hand chart) although it has reached its Impulsive targets up ("I up Done") is still in an uptrend. We don't like to anticipate the anticipation, but do believe that the next move up could trigger Impulsive 2 targets (our more extended targets). These could lead us up to the 130 - 140 USD/JPY range over the course of the year. We would need to confirm this once/if these Impulsive 2 targets are ignited on the Weekly chart.
Now back to Abenomics. On the financing side, the Bank of Japan is apparently sucking up circa 90% of new Government issues and by the end of the year should hold circa 30% of the Japanese Government bond stock. In fact, it is largely financing the Government deficit as well as indirectly allowing Japan to refinance debt at very low rates (at 0.4%, up from 0.2% in January). This is a unique opportunity given Japan's 250% Debt to GDP ratio. Maintaining interest rates as such artificially low levels allows it to keep interest costs under control. To do so, it must act as buyer of last resource in the secondary market. Commitment is key as there is no turning back if Japan wants to avoid a run on its debt.
This policy is coming to a test. Indeed over the last few weeks, Japan's largest institutional investors have announced massive reallocations programs into equities and foreign investment (you may read up on the Japan's Post Holding's and GPIF, the Government pension fund, which together hold circa $2 trillion of Governments bonds). Many other Japanese institutions are most probably following suit. Japanese interest rates have started to move higher (20 basis points in a month). These levels are still low, but one could wonder how much leeway does the BOJ still have before it becomes a problem. What is certain, is that Japan would want to avoid a Government Bond sell-off at all cost. Hence, sooner or later, the BOJ will probably have to step up its bond buying program to meet supply and keep cornering the market to keep interest rates low.
Japanese 10Y Government Bond Yields - Daily chart
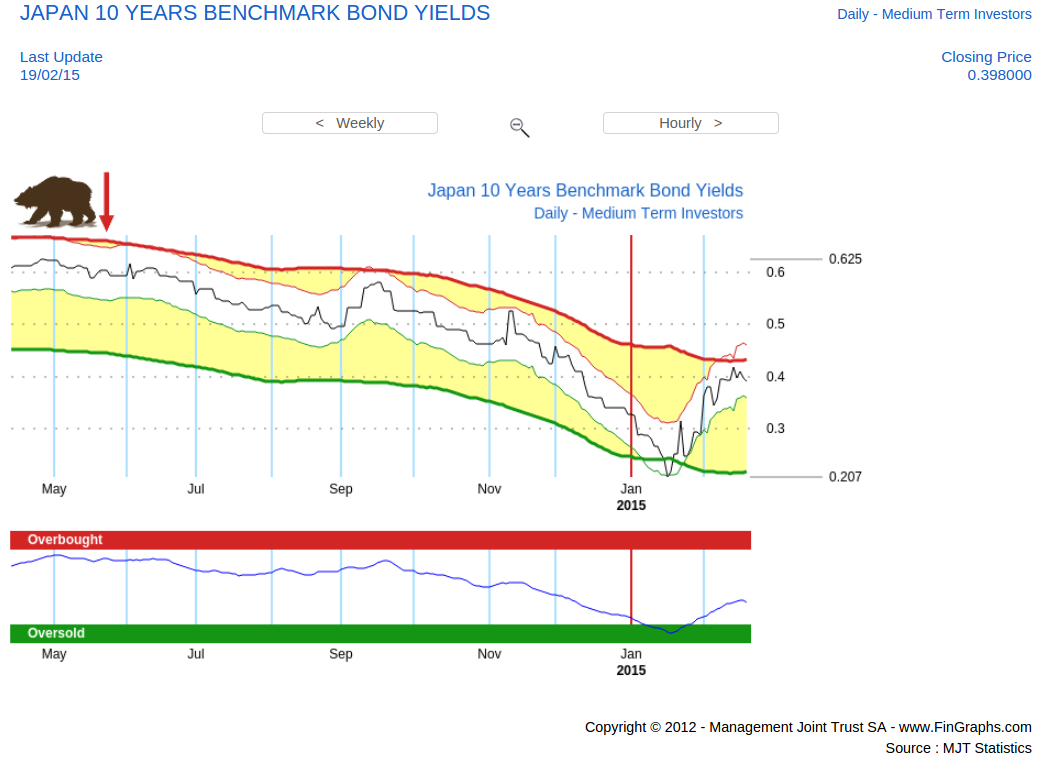
Following lows close to 0.20% in January, 10 Years Japanese Government Bond yield have snapped back quite rapidly over the last few weeks. Our FinGraphs Daily chart (perspective over the few months) is now neutral with a negative Bear trend but "No targets". The price move still seems corrective for now. Probabilities are that the BOJ cannot afford this trend to turn into a sustained Bull.
Hence, we believe there's increasing stimulus down the line and if recent past is any guide, this is great for Japanese equities.
Nikkei 225 - Investor's View:
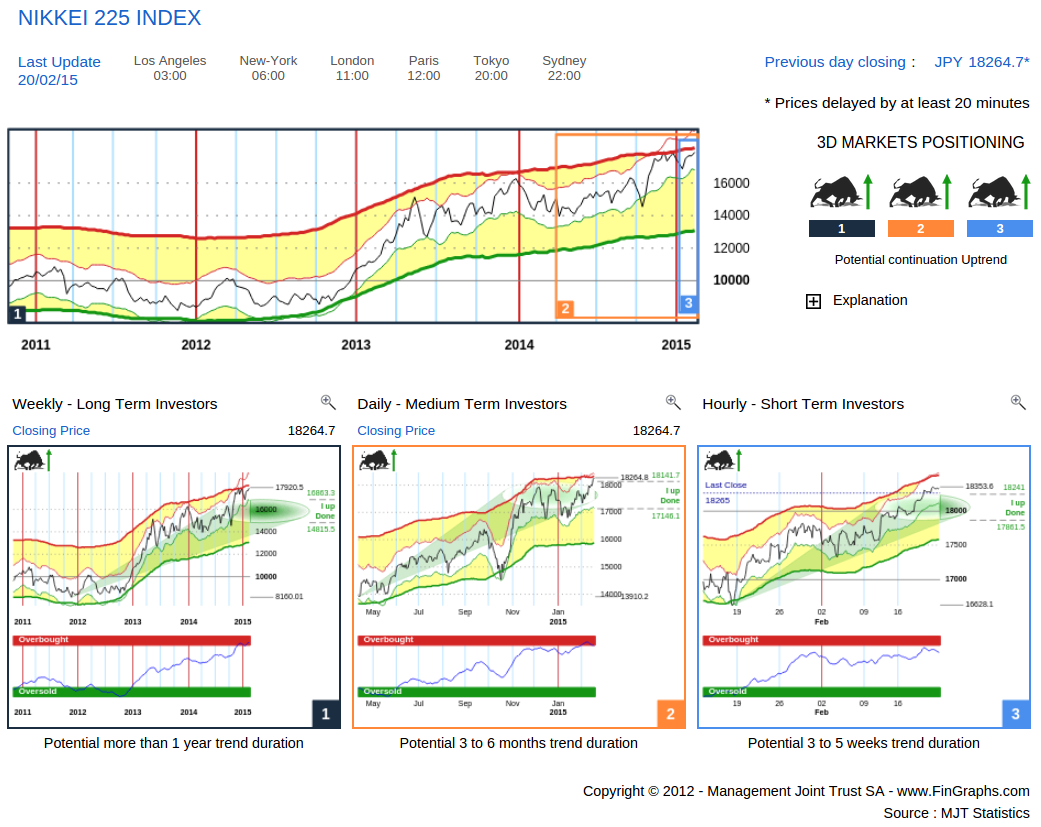
Although quite exhausted, all three trends are still heading up. As with USD/JPY, our Weekly (left hand chart) impulsive targets have been met ("I up done"). If again, we anticipate the anticipation, we could calculate Impulsive 2 extensive targets [just to be clear Impulsive 3 targets do not exist in our methodology]. These would imply that the Nikkei 225 could reach a range between 23'000 and 26'000 over the next year in this extended scenario. We would need to confirm this once/if these Impulsive 2 targets are ignited on the Weekly chart.
Note: we do not show the hedged DXJ Wisdom Tree ETF here, but apart from its regular lump dividend distributions, it should have a similar profile.
That said, EWJ, the iShares non hedged ETF also looks well positioned.
EWJ - Investor's View:
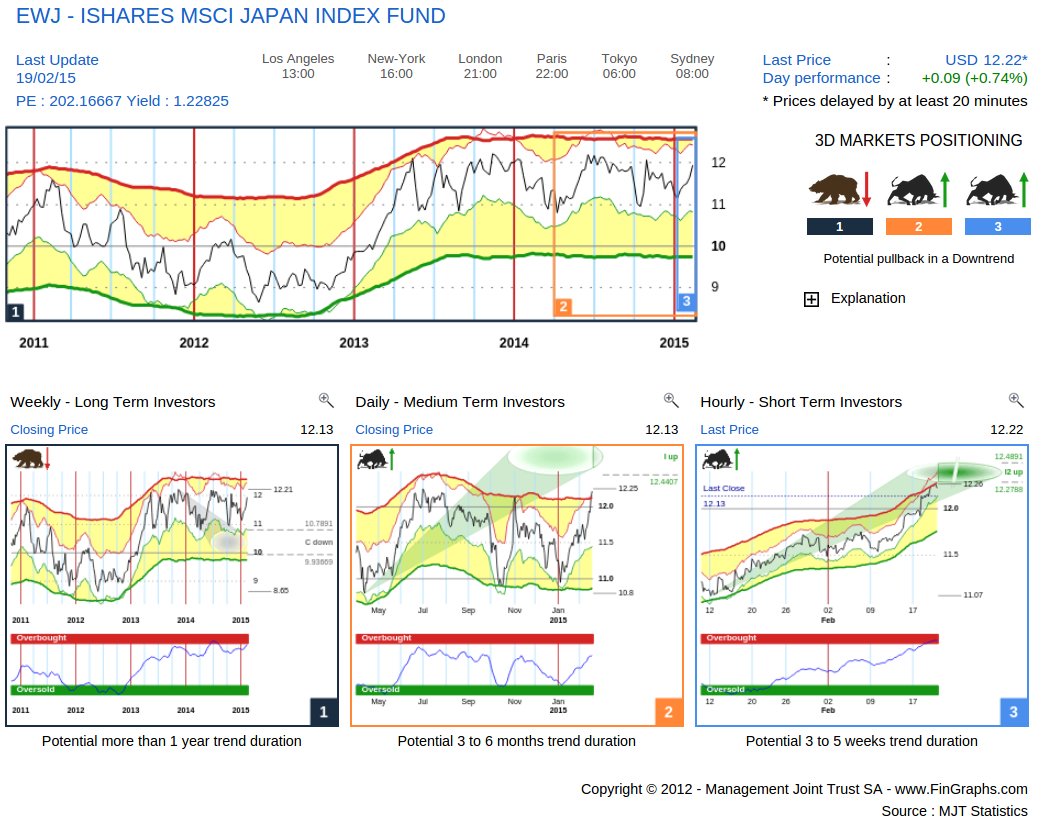
The longer term Weekly (right hand chart) is close to breaking out from consolidation period. The Daily (middle) is well positioned, has recently move out of an Oversold position in our Risk Index and is showing promising potential over the next few months. Only the shorter term Hourly (right hand chart) is a bit extended. This would imply that the breakout will probably need a few more weeks to materialize.
As for our Impulsive 2 calculations above on the Nikkei and USD/JPY, it seems that the Nikkei's performance should more than compensate the YEN's depreciation. For the record, our targets are calculated from our historical estimate of standard deviation (we label it "delta"). It is a proxy for recent historical volatility. In this case, the Nikkei's registers a higher delta that the YEN (is more volatile). This would confirm our bullish stance on EWJ above.
It is again, this week, a positive scenario on one of the major equity markets and it is also one which is probably widely dependent on the BOJ being able to smoothly execute its QE program. Yet, trends are still heading up both on the Nikkei 225 and USD/JPY on our Weekly charts. Hence, although we may live in a somewhat artificial world, we would give these markets the benefit of the doubt as long as we don't have any contradictory signals.
For more information on our methodology, visit our website at fingraphs.com where you can view our Introduction slide-show and visit the 'User Guide' section. A 7 days free demo is also available if you register.
Have a great weekend, J-F Owczarczak (@fingraphs)