To start the trading day, the market futures were up a fair amount as the second quarter GDP print came in higher than expected, a 4% increase. Everyone seemed to be rejoicing and loving this key economic data point. However, since that release the market has started to fall.
Why is this happening you ask?
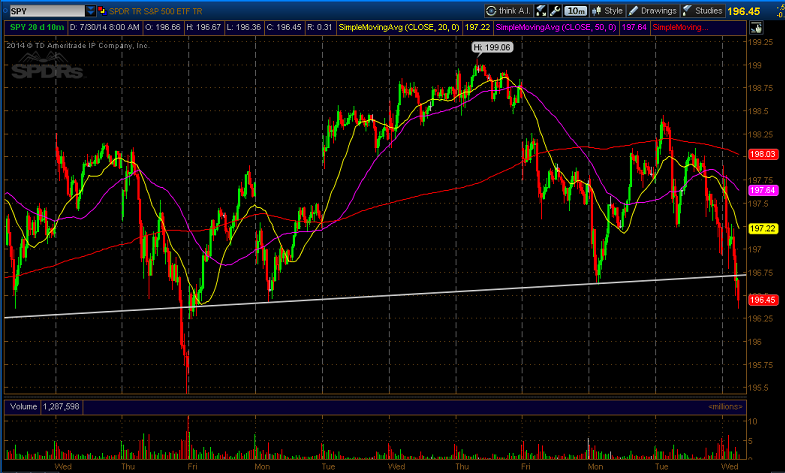
Well, with the data coming in better than expected, and the economy on seemingly improved footing, the FED (which concludes its two day meeting today) will continue to taper and possibly raise rates sooner than the markets would like. So while you will hear a ton of reason why the market will bounce or fall today, I will simply be looking for a break of this very important trend line noted in the following chart of the SPDR S&P 500 ETF Trust (NYSEARCA:SPY). If this line does break, then that will trigger a technical chart formation called a "Head and Shoulders" pattern, and that line is considered the neckline. This pattern is bearish and telling us there is more downside to come.
Parm Mann
InTheMoneyStocks.com