Barchart.coms Chart of the Day -
Roper Industries (ROP)Barchart Research Team - BC - Tue Nov 06, 3:52PM CST
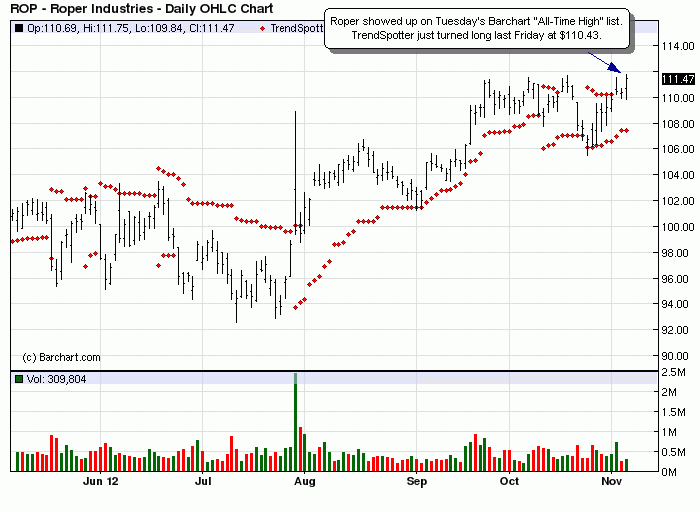
The "Chart of the Day" is Roper Industries (ROP), which showed up on Tuesday's Barchart "All-Time High" list. Roper on Tuesday posted a new all-time high of $111.75 and closed +0.99%. TrendSpotter just turned long last Friday at $110.43. Chart of the Day last featured Roper Indusries as of the Jan 6, 2012 close of $89.94. In recent news on the stock, Roper on Oct 25 reported Q3 EPS of $1.24, slightly above the consensus of $1.23. Barclays on Sep 13 reinitiated coverage on Roper with an Overweight and a target of $120. Roper Industries, with a market cap of $10 billion, manufactures and distributes specialty industrial controls, fluid handling and analytical instrumentation products worldwide, serving selected segments of a broad range of markets such as oil & gas, scientific research, medical diagnostics, semiconductor, microscopy, chemical and petrochemical processing, large diesel engine and turbine/compressor control applications, bulk-liquid trucking, power generation, and agricultural irrigation industries.
How we found the Chart of the Day:
We found the "Chart of the Day" by scanning the Barchart "All Time High" list. In order to get to that list, we first clicked on the Stocks menu item on the Barchart home page, then on the "All Time Highs" menu item on the left menu bar. We then sorted the list by percentage gainers by clicking on the "Percent" column title. A stock that has posted a new All-Time high is typically showing strong upside momentum.
The status of Barchart's Opinion trading systems are listed below. Please note that the Barchart Opinion indicators are updated live during the session every 10 minutes and can therefore change during the day as the market fluctuates. The indicator numbers shown below therefore may not match what you see live on the Barchart.com web site when you read this report.
- TrendSpotter: Buy
- Short-Term Indicators: 80% Buy
- Medium-Term Indicators: 75% Buy
- Long-Term Indicators: 100% Buy
- Overall Average 88% Buy
Barchart links for further information:
Quotes and Charts
Quote
Detailed Quote
Chart
Technical Analysis
Technicals Summary
Trader's Cheat Sheet™
Barchart Opinions
Barchart Opinion
Barchart Snapshot
Trading Strategies
Company Info
Company Profile
Key Statistics
Ratios
Income Statement-Quarterly
Income Statement-Annual
Balance Sheet-Current
Balance Sheet-Annual
Chart of the Day Archive
View Past Chart of the Day Reports