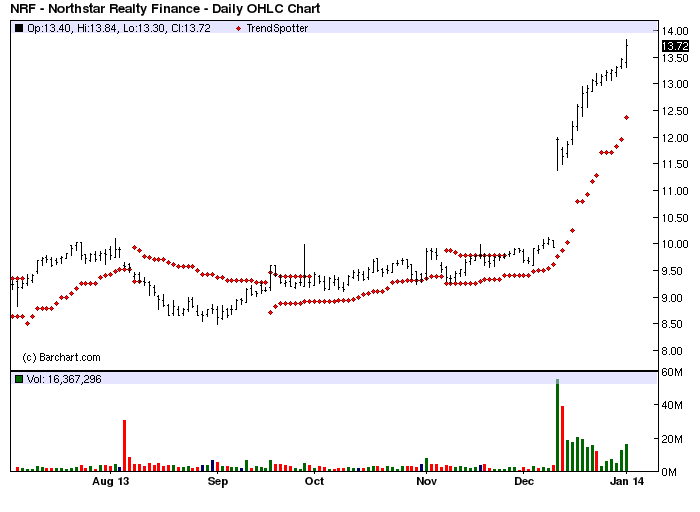
The Chart of the Day is Northstar Realty Finance (NRF). I found the stock by sorting the New High List for frequency in the last month, and eliminated the stock that did not have positive gains for the last week and month. Last;y, I used the Flipchart feature to review the charts. Since the Trend Spotter signaled a buy on 11/26 the stock gained 39.92%.
It is an internally-managed REIT that makes fixed income, structured finance and net lease investments in commercial real estate assets. NorthStar Realty's business consists of three core business lines: subordinate real estate debt, real estate securities and net lease properties.
Barchart's Opinion trading systems are listed below. Please note that the Barchart Opinion indicators are updated live during the session every 10 minutes and can therefore change during the day as the market fluctuates. The indicator numbers shown below therefore may not match what you see live on the Barchart.com web site when you read this report.
Barchart technical indicators:
- 96% Barchart technical buy signals
- Trend Spotter buy signal
- Above its 20, 50 and 100 day moving averages
- 17 new highs and up 41.59% in the last month
- Relative Strength Index 87.10%
- Barchart computes a technical support level at 13.08
- Recently traded at 13.72 with a 50 day moving average of 10.62
Fundamental factors:
- Market Cap $3.22 billion
- P/E 10.08
- Dividend yield 6.31%
- Revenue projected to increase 17.00% this year and another 17.20% next year
- Earnings estimated to be down 35.10% this year but increase again by 12.60% next year
- Wall Street analysts issued 1 strong buy and 4 buy recommendations
The stock has been increasing in both volume and price. Use the 100 day moving average as your exit point.