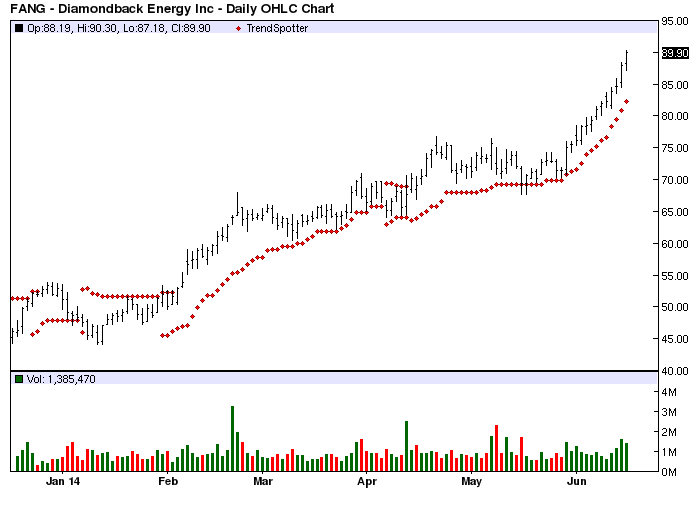
The Chart of the Day belongs to Diamondback Energy (FANG). I found the stock by sorting the New High list for frequency in the last month then used the Flipchart feature to review the charts. Since the Trend Spotter signaled a buy on 4/14 the stock gained 28.21%.
FANG is an oil and natural gas company focused on the acquisition, development, exploration and exploitation of unconventional, onshore oil and natural gas reserves in the Permian Basin in West Texas. The Company's activities are primarily focused on the Clearfork, Spraberry, Wolfcamp, Cline, Strawn and Atoka formations.
The status of Barchart's Opinion trading systems are listed below. Please note that the Barchart Opinion indicators are updated live during the session every 10 minutes and can therefore change during the day as the market fluctuates. The indicator numbers shown below therefore may not match what you see live on the Barchart.com web site when you read this report.
Barchart technical indicators:
- 100% Barchart technical buy signals
- Trend Spotter buy signal
- Above its 20, 50 and 100 day moving averages
- 17 new highs and up 27.21% in the last month
- Relative Strength Index 82.91%
- Barchart computes a technical support level at 86.01
- Recently traded at 89.90 with a 50 day moving average of 73.89
Fundamental factors:
- Market Cap $4.55 billion
- P/E 52.28
- Revenue expected to grow 140.90% this year and another 38.70% next year
- Earnings estimated to increase 128.90% this year, an additional 34.30% next year and continue to increase at an annual rate of 60.00% for the next 5 years
- Wall Street analysts issued 3 strong buy, 12 buy and 4 hold recommendations on the stock
With the numbers this stock has I can't understand how it flew under my radar for so long. Since we are so late to the party watch that 50 day moving average for signs of weakness,