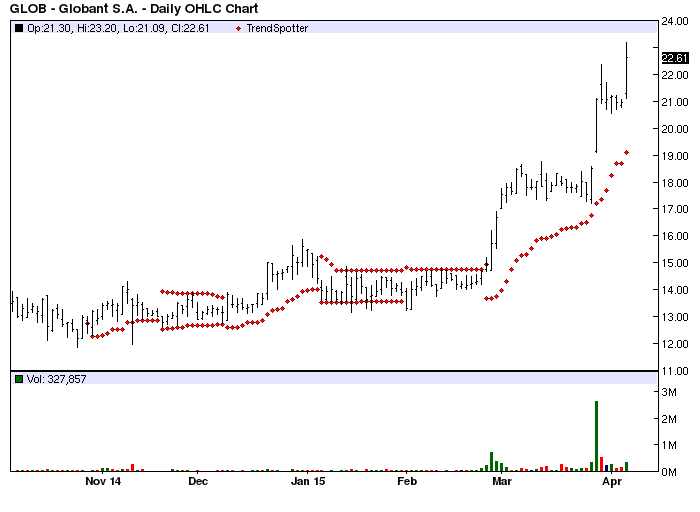
The Chart of the Day belongs to Globant (GLOB). I found the stock by sorting the All Time High list for the stocks with the best technical buy signals then used the Flipchart feature to review the charts. Since the Trend Spotter signaled a buy on 2/25 the stock gained 50.87%.
Globant S.A. is a technology services provider. The Company provides engineering, design, and innovation services for clients. Globant offers content management systems; and e-commerce applications. It is also involved in the provision of data management solutions; and quality assurance engagement strategy, mobile testing, test automation, load and performance testing, and game testing services. It provides various software solutions primarily in North America, Europe, Latin America, and internationally.
Barchart's Opinion trading systems are listed below. Please note that the Barchart Opinion indicators are updated live during the session every 10 minutes and can therefore change during the day as the market fluctuates. The indicator numbers shown below therefore may not match what you see live on the Barchart.com web site when you read this report.
Barchart technical indicators:
- 100% Barchart technical buy signals
- Trend Spotter buy signal
- Above its 20, 50 and 100 day moving averages
- 5 new highs and up 22.77% in the last month
- Relative Strength Index 81.31%
- Barchart computes a technical support level at 20.62
- Recently traded at 22.61 with a 50 day moving average of 16.69
Fundamental factors:
- Market Cap $754.04
- P/E 18.17
- Revenue expected to grow 20.60% this year and another 20.50% next year
- Earnings estimated to increase by 11.40% this year, an additional 19.30% next year and continue to compound at an annual rate of 20.00% for the next 5 years
- Wall Street analysts issued 2 strong buy and 2 buy recommendations
Use a stop loss 10% below most recent high as an exit point.