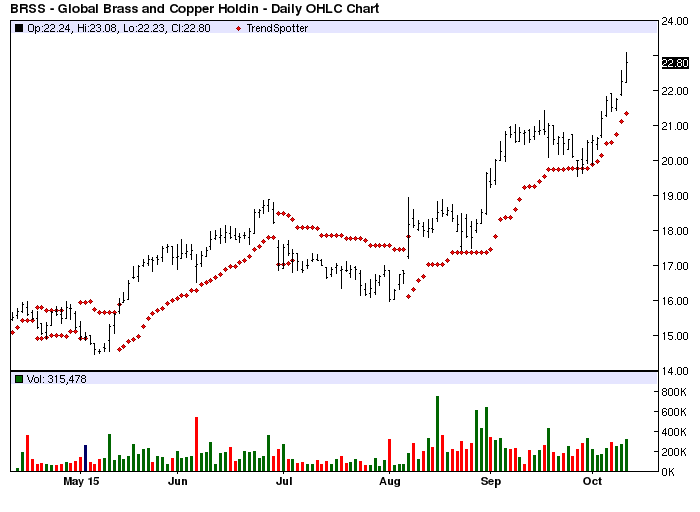
The Chart of the Day belongs to Global Brass and Copper (BRSS). I found the stock by using Barchart to sort first for the stocks with a Weighted Alpha of over 50.00+ then again for technical buy signals of 80% or better. Since the Trend Spotter signaled a buy on 8/78 the stock gained 25.48%.
Global Brass & Copper Holdings, Inc. is a converter, fabricator, distributor and processor of copper and brass products primarily in North America. The Company's product include sheet, strip, foil, rod, tube and fabricated metal component that it sells under the Olin Brass, Chase Brass and A.J. Oster brand names. It also engages in metal melting and casting, rolling, drawing, extruding and stamping to fabricate finished and semi-finished alloy products. The company serves building and housing, munitions, automotive, transportation, coinage, electronics/electrical components, industrial machinery and equipment and general consumer end markets. Global Brass & Copper Holdings, Inc. is headquartered in Schaumburg, United States.
The status of Barchart's Opinion trading systems are listed below. Please note that the Barchart Opinion indicators are updated live during the session every 10 minutes and can therefore change during the day as the market fluctuates. The indicator numbers shown below therefore may not match what you see live on the Barchart.com web site when you read this report.
Barchart technical indicators:
- 100% Barchart technical buy signals
- 76.90+ Weighted Alpha
- Trend Spotter buy signal
- Above its 20, 50 and 100 day moving averages
- 8 new highs and up 9.67% in the last month
- Relative Strength Index 77.45%
- Barchart computes a technical support level at 21.52
- Recently trade at 22.80 with a 50 day moving average of 19.58
Fundamental factors:
- Market Cap $489.97 million
- P/E 10.30
- Dividend yield .70%
- Revenue expected to decrease 8% this year but increase again by 2.10% next year
- Earnings estimated to increase at an annual rate of 14.70% this year, an additional 2.00% next year and continue to compound at an annual rate of 10.00% for the next 5 years
- Wall Street analysts issued 1 strong buy and 4 hold recommendations on the stock
The 50-100 day MACD Oscillator has been a reliable technical trading strategy for this stock.