Barchart.coms Chart of the Day - Pembina Pipeline (PBA)
Barchart Research Team - BC - Sun May 06, 11:11AM CDT
Related Stocks
PBA - Pembina Pipeline Cor
| Sym | Last | Chg | Pct |
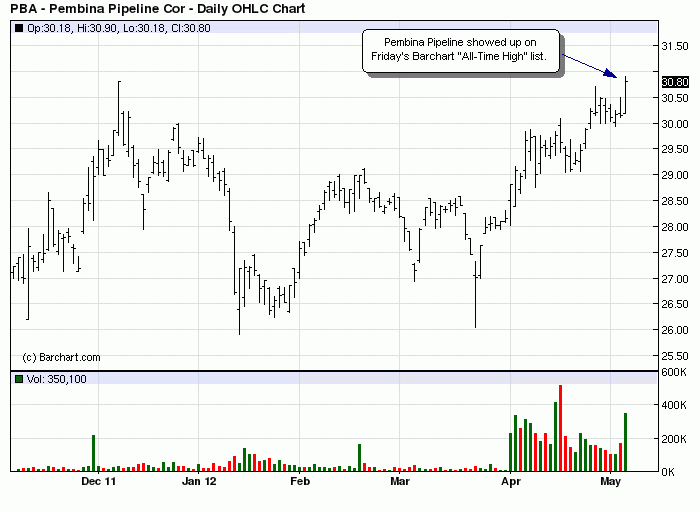
| PBA | 30.80 | +0.65 | +2.16% |
The "Chart of the Day" is Pembina Pipeline (PBA), which showed up on Friday's Barchart "All-Time High" list. Pembina on Friday posted a new all-time high of $30.90 and closed up 2.16%. In recent news on the stock, Canaccord on May 4 upgraded Pembina Pipeline to Buy from Hold. Pembina Pipeline on May reported Q1 EPS of 19 cents and reported volume growth of 15%. Pembina Pipeline, with a market cap of $5 billion, is an energy transportation and service provider based in Canada. The Company operates in four segments; Conventional Pipelines, Oil Sands & Heavy Oil, Midstream & Marketing, and Gas Services. The Conventional Pipelines segment operates a pipeline network that transports crude oil, condensate, and natural gas liquids in Alberta and British Columbia.
How we found the Chart of the Day:
We found the "Chart of the Day" by scanning the Barchart "All Time High" list. In order to get to that list, we first clicked on the Stocks menu item on the Barchart home page, then on the "All Time Highs" menu item on the left menu bar. We then sorted the list by percentage gainers by clicking on the "Percent" column title. A stock that has posted a new All-Time high is typically showing strong upside momentum.
The status of Barchart's Opinion trading systems are listed below. Please note that the Barchart Opinion indicators are updated live during the session every 10 minutes and can therefore change during the day as the market fluctuates. The indicator numbers shown below therefore may not match what you see live on the Barchart.com web site when you read this report.
- TrendSpotter: Buy
- Short-Term Indicators: 100% Buy
- Medium-Term Indicators: 100% Buy
- Long-Term Indicators: 100% Buy
- Overall Average 100% Buy
Barchart links for further information:
Quotes and Charts
Quote
Detailed Quote
Chart
Technical Analysis
Technicals Summary
Trader's Cheat Sheet™
Barchart Opinions
Barchart Opinion
Barchart Snapshot
Trading Strategies
Company Info
Company Profile
Key Statistics
Ratios
Income Statement-Quarterly
Income Statement-Annual
Balance Sheet-Current
Balance Sheet-Annual
Chart of the Day Archive
View Past Chart of the Day Reports