In the article I will present a quantitative timing model developed by me, and current trend recommendation for S&P 500 for February 2015
About model:
The aim of the model is to generate signal about the actual trend on the market. Model inputs are variables like volatility, volume and price momentum.
The main assumption about the model, is that:
Uptrend market is when price and demand (volume) is increasing and volatility is low.
For downtrend scenario model assumptions are: decreasing price, high volatility (panic in the market) and demand is increasing (downtrend is proved by high volume)
Outcome:
Current S&P500 Trend: UPTREND
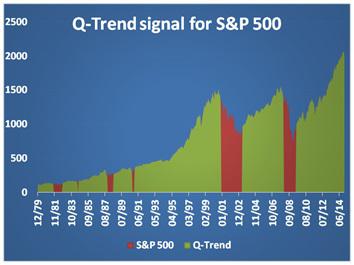
In the attached chart and table you can see when the model was giving uptrend signal (green) and downtrend signal (red). As you see model allow to be out of the market during a crisis like financial crisis in 2008 and dot-com bubble in 2003. The model is very useful for medium and long-term investors, because model signals have got time horizon between 2 to 10 years.
Summarizing:
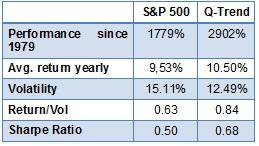
· Q-Trend has got a 2902% performance since 1979 vs 1779% for S&P 500
· The Sharpe ratio for the Q-Trend model is higher than the benchmark, so You get higher performance with lower risk.
P.S If you want to get monthly updates about Q-Trend mode please register for newsletter at: quantbeatmarket.com/newsletter/