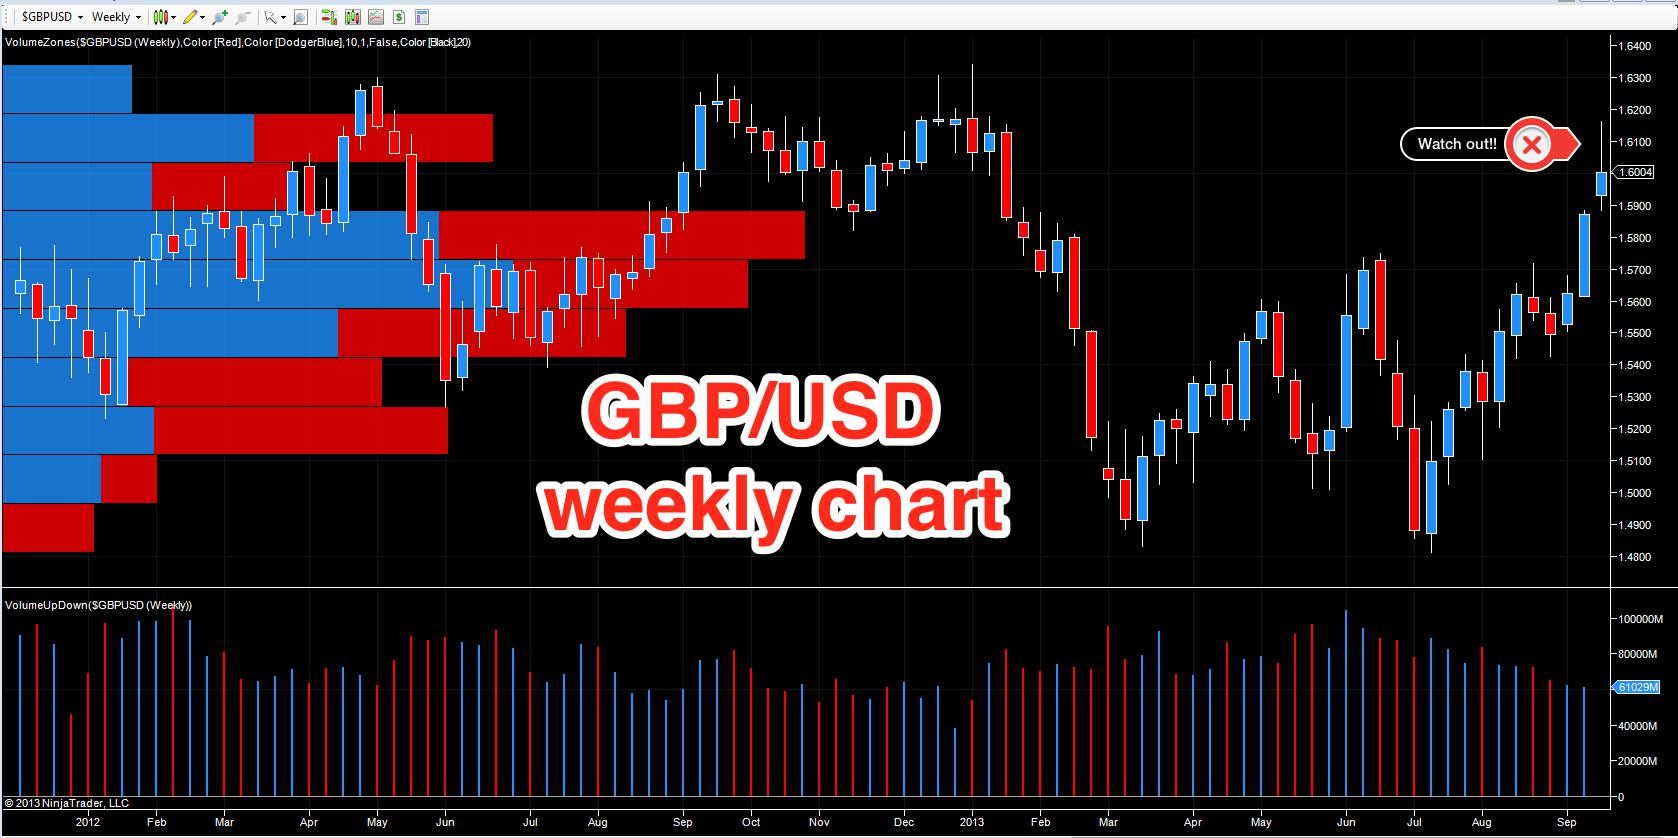
At the beginning of a new trading week it's sometimes useful to step back and consider the dominant trend on a longer time frame, and in addition, the potential for any short term reversal. One such example can be found on the weekly chart for cable, where last week's bullish price action during the early part of the week, was tempered by some profit taking on Thursday and Friday, leaving us with a classic shooting star candle.
In football (soccer) parlance, the shooting star candle is most definitely premier league. It is also one of those candles which, when considered with volume, gives us one of the strongest trading signals. Even if you do not consider volume in your trading, the candle is indicative of short term weakness purely based on the price action alone.
In addition, and to add further weight to this analysis, cable is also running into some serious resistance at 1.62-1.63, a price region created during 2012. Furthermore, you will also note that volumes in the uptrend have been falling throughout the summer months, so in other words we have had a rising market on falling volume - a clear anomaly, and another sign of weakness.
Given the above we can expect to see cable pull back in the short term and possibly move into a phase of price consolidation somewhere between 1.5750 and 1.59. Between these price points there is deep congestion, as shown by the volume at price histogram which should provide a platform of support in any pullback.
If you have found this post useful please share with your fellow traders.
You can follow more of my market forecasts on my personal site at http://www.annacoulling.com
Grab a copy of my latest books on Amazon:

www.amazon.com/gp/product/B00DGA8LZC/ref

www.amazon.com/Three-Dimensional-Approach-Trading-ebook/dp/B00CX2QCVO/ref
By Anna Coulling