As September came to a close, we had a very interesting day. The market jumped initially before it went down hard. The bulk of the day saw a gradual rise to even, then another sharp push down was followed by a gradual rise to just under even. What does it all mean? I think it was the bears wringing out everything they could get before the next leg up on this 2009 rally. Let me explain.
The question of whether or not we are in a bull market rally was settled on July 17th when the market had a 10% retracement and started a second leg upwards. Even the most hardened bears, had to get in at the summer’s end. I felt a little sorry for them. They couldn’t buy Apple or Google or IBM or US steel. No, they had to buy Fannie Mae, AIG, Citi Bank etc., etc. These were the leftovers, the crumbs on the floor. They were responsible for Bank of America’s move from $12 to $18. The long positions were happy to see these folks sitting on the sidelines get in. It was the icing on the cake.
So what about now? What might happen between now and the year’s end? The bear and bull pundits are all saying the same sort of things. The bulls are hopelessly optimistic. The bears are just waiting for any negative news to start shorting the rally. The bears don’t need it. They have probably made all the profits they needed for the year. In addition, they had a great 2008. But the bulls on the other hand, had a bad 2008 followed by rather tough losses in the first quarter in 2009. It’s been a good summer for the bulls, but they need this rally to continue until year’s end. I’m just guessing, but I think the stage is set for a strong 3rd leg up. I base this statement simply on the fact that the bulls need it. It’s one thing for a broker or fund manager to have a bad 2008. It’s quite another to have two bad years in a row. That’s when heads roll.
The bulls must push on. With the new earnings season starting October 7th with Alcoa, I expect the bulls to take advantage of the hope that companies have become much more efficient. It appears, and I cannot be sure, but it appears that companies will be reporting both bottom and top line increases. Who can say if it will last more than a quarter, but it appears that the third quarter is posed report better than the second. This will be the fuel that feeds the hungry bulls. The market is fickle. It has a heart and soul, and it has a technical side.
For those 5 followers that like to read my blogs, you know that I discuss the technical reasons to buy or sell a stock. I have discussed the so-called Fibonacci (Fib) levels within a discussion of Spectrum Pharmaceuticals so that the average trader can use free tools to casually perform their own technical analysis. My objective is to bring the tools that I like to use to the average investor. it’s like a Penn and Teller sort of thing. I’m just revealing the magic.
\In my previous blogs, I have described how the Fibonacci levels end up being the places where the price action settles for a stock. Now I want to use the same science to PREDICT the movement of the S&P as a whole. It’s ambitious I know.
\In my previous blogs, I have described how the Fibonacci levels end up being the places where the price action settles for a stock. Now I want to use the same science to PREDICT the movement of the S&P as a whole. It’s ambitious I know.
Here’s my premise. If I can lay down the Fibonacci retracement lines on a historical stock rise and fall and see that the stock has followed the Fib levels from a previous low to the high, I should be able to guess when a stock is moving to a new high, and knowing the previous low, the Fib levels will fall into place. Are you with me here? If not, let’s look at the S&P 500.

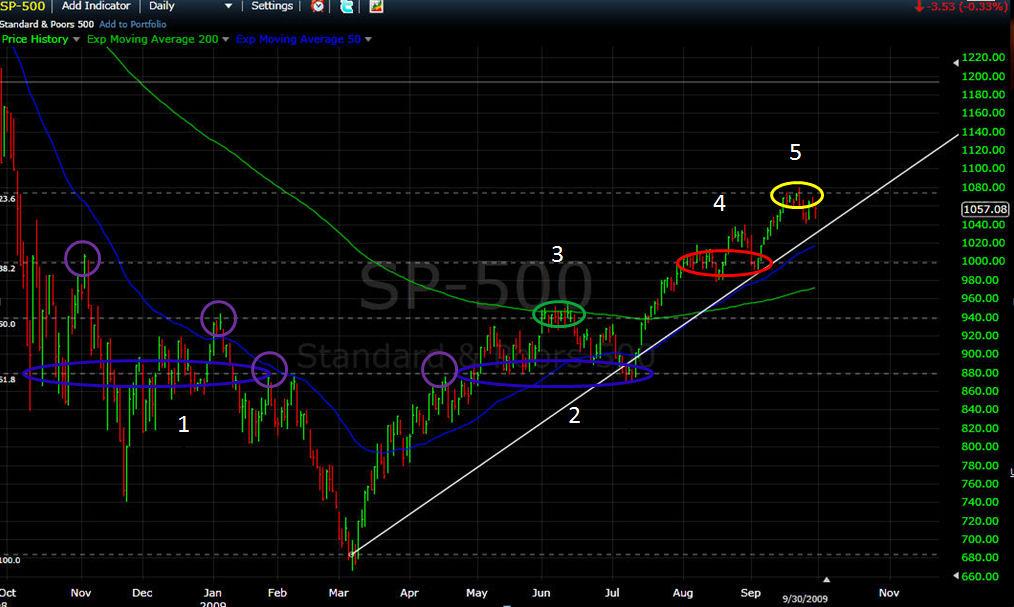
This figure is a little complicated so I will do my best to explain the patterns that I see. First there are the purple circles. These are points of Fibonacci resistance during the S&P downturn starting in 2008 and ending in March 2009. Next, let’s look at the blue ellipses. The first one is rough. It averages about on the S&P 880 price. It occurs during the panic which runs from October 10 to February 10. It acts as resistance in February and support in May and July. That’s a key number. I do not expect the S&P to ever break down below 880. If it does, something terribly bad has happened again.
With regards to the rally, there has been only one retracement. On June 1st we were at 940. By July 8th , we were at 878. It was a 10% retracement that followed the Fibonacci levels precisely. Now I need to make a clear distinction between a retracement and a consolidation. A retracement is when the entire market decides that it’s overvalued. A consolidation is when a smaller sub-group of the market decides to take profits. On June 12th, the entire market realized that it was getting overvalued. We had a tremendous rally off the March lows. Profits were taken. The bears, who were tanning in the summer sun, came back, seeing the full retracement from Fib 50% to Fib 61.8%, they jumped into the rally. They are responsible for the second leg of the rally which ran from July 8th to August 5th (the end of the blue ellipse #2 to the beginning of the red ellipse). The red ellipse represents a time frame that shows bear trader’s taking quick profits. It’s a subset of the market because there was no retracement to lower Fibonacci levels. Longs are still long. Bears are still long. Traders are going long and short at this time.
The month of September shows that we moved from the 38.2% Fib level to the 23.6% level. And this is my point. I have drawn a predictive chart which starts at the March lows and tops off at S&P 1200 at Christmas. By doing this I am placing myself in the future as if it has occurred. If this is not the path of the market, the Fib levels would not match what we have seen since March. If it is possible, they must match. They do match. This suggests to me that the S&P is going to 1200 by years end. The only technical alternative is S&P 1000, but for subjective reasons listed above, I don't believe it's in the cards.