Please Note: Blog posts are not selected, edited or screened by Seeking Alpha editors.
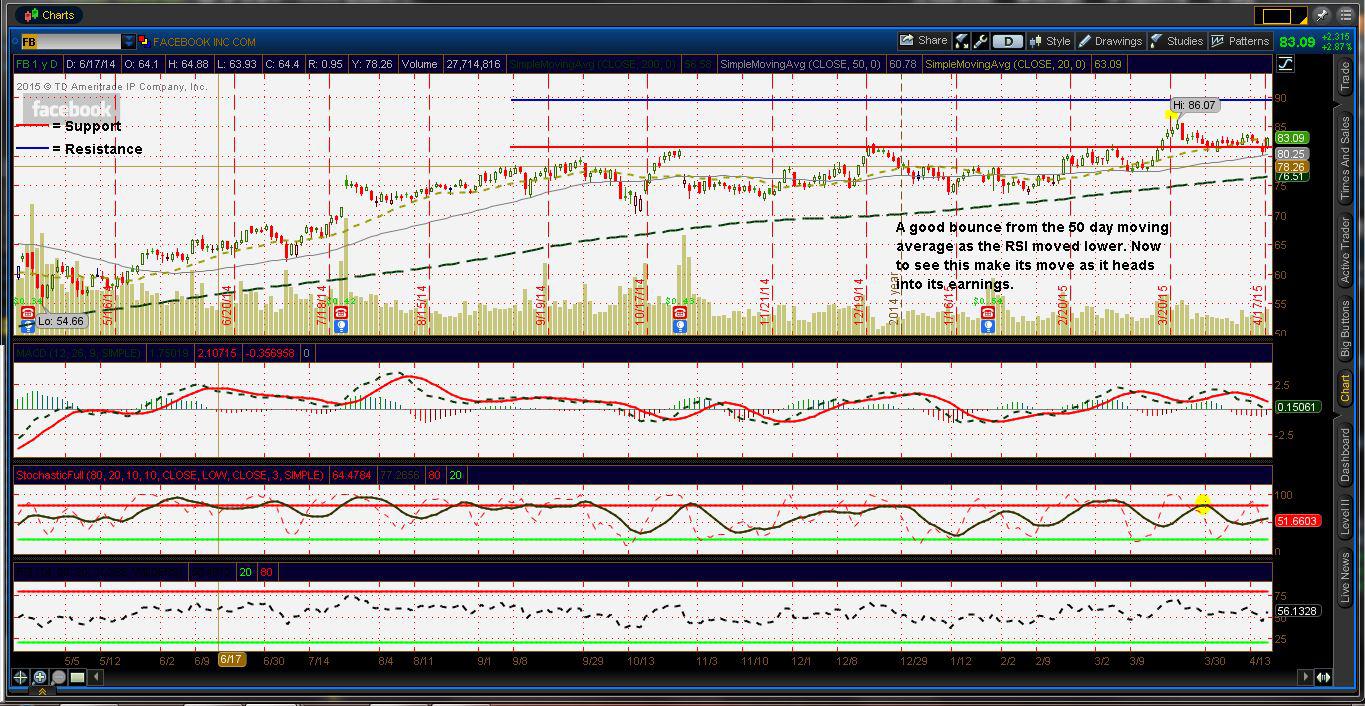
Facebook made a very nice bounce from the 50 day moving average. it was a much needed reminder to the bulls of this stock since worry started to come in after it created so many red days since its 52 week high. This is just putting itself in position for an earnings move again. Still above support, still good to go.
Seeking Alpha's Disclosure: Past performance is no guarantee of future results. No recommendation or advice is being given as to whether any investment is suitable for a particular investor. Any views or opinions expressed above may not reflect those of Seeking Alpha as a whole. Seeking Alpha is not a licensed securities dealer, broker or US investment adviser or investment bank. Our analysts are third party authors that include both professional investors and individual investors who may not be licensed or certified by any institute or regulatory body.