Please Note: Blog posts are not selected, edited or screened by Seeking Alpha editors.
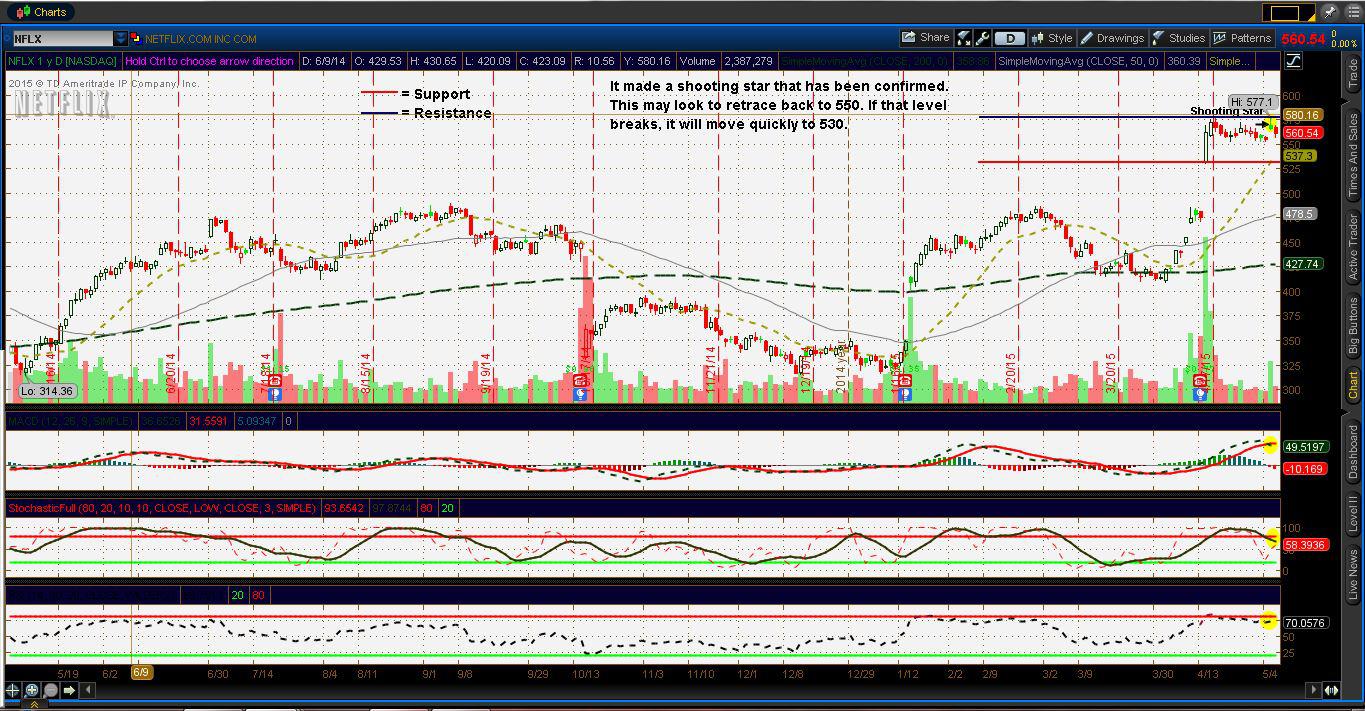
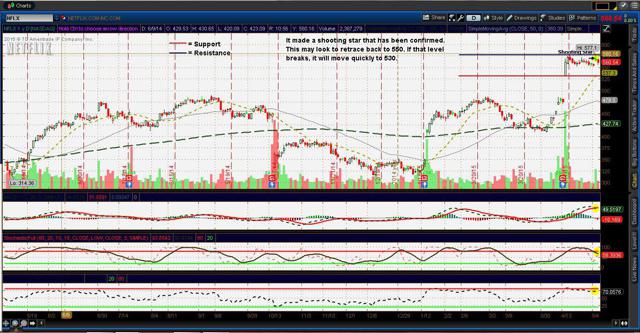
Netflix created a shooting star candle when it created its new high. This candle is a fairly dependable single candle reversal signal when confirmed. It was confirmed with a close below the shooting star. With the indicators starting to move lower, this is looking to first retest 550. If it breaks 550, it will advance to 530 fairly quick. My price target will depend on that break occurring.
Seeking Alpha's Disclosure: Past performance is no guarantee of future results. No recommendation or advice is being given as to whether any investment is suitable for a particular investor. Any views or opinions expressed above may not reflect those of Seeking Alpha as a whole. Seeking Alpha is not a licensed securities dealer, broker or US investment adviser or investment bank. Our analysts are third party authors that include both professional investors and individual investors who may not be licensed or certified by any institute or regulatory body.