When I have to make a decision in general I first take 'emotion' out of the equation. I can always add back 'emotion' to the equation later. First I want the facts.
When valuing a company we need to start with company data (the facts). I use paid data from The Financial Times. It is with this data that I make a bar chart. See below.
www.ft.com/home/europe
Let's go back to the question we have to solve : Is Facebook Worth Our Investment Money ?
Data please. I need 9 inputs of data.
- The market value of the company or Market Capitalization. MC.
- Balance sheet data : Total Current Assets. TCA.
- Balance sheet data : Total Non Current Assets. TNCA.
- Balance sheet data : Total Current Liabilities. TCL.
- Balance sheet data : Total Non Current Liabilities. TNCL.
- Income statement data : Sales. S.
- Income statement data : Earnings. E.
- Income statement data : 5 year average Sales. S5
- Income statement data : 5 year average Earnings. E5.
Now we can arrange this data in a way that the data becomes comprehensive. We will make Facebook's Market Capitalization of 212,105,623,894 USD equal to 100. And...compare Balance sheet data and Income Statement data with the Market Capitalization that is set to 100. So instead of absolute data I use relative data.
You can find below the bar chart of Facebook. As always : MC = 100. Take a look please and you will
soon understand how useful this bar chart is in making sound investing decisions.
In my next blog , I 'll discuss the bar chart below in more detail. But for now I can already say that the price we have to pay for the company , represented by the first bar , is too high compared with the value we get, represented by the 8 following bars.
Is Facebook worth our investment money ? I think no.
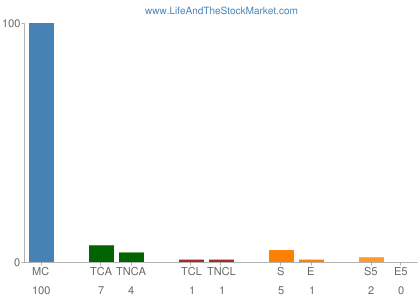
MC = Market Capitalization = 100
TCA = Total Current Assets / TNCA = Total Current Assets
TCL = Total Current Liabilities / TNCL = Total Current Liabilities
S = Sales / E = Earnings
S5 = 5 Year Average Sales / E = 5 Year Average Earnings